GLOBAL ECONOMICS AND POLITICS
Leo Haviland provides clients with original, provocative, cutting-edge fundamental supply/demand and technical research on major financial marketplaces and trends. He also offers independent consulting and risk management advice.
Haviland’s expertise is macro. He focuses on the intertwining of equity, debt, currency, and commodity arenas, including the political players, regulatory approaches, social factors, and rhetoric that affect them. In a changing and dynamic global economy, Haviland’s mission remains constant – to give timely, value-added marketplace insights and foresights.
Leo Haviland has three decades of experience in the Wall Street trading environment. He has worked for Goldman Sachs, Sempra Energy Trading, and other institutions. In his research and sales career in stock, interest rate, foreign exchange, and commodity battlefields, he has dealt with numerous and diverse financial institutions and individuals. Haviland is a graduate of the University of Chicago (Phi Beta Kappa) and the Cornell Law School.
Subscribe to Leo Haviland’s BLOG to receive updates and new marketplace essays.

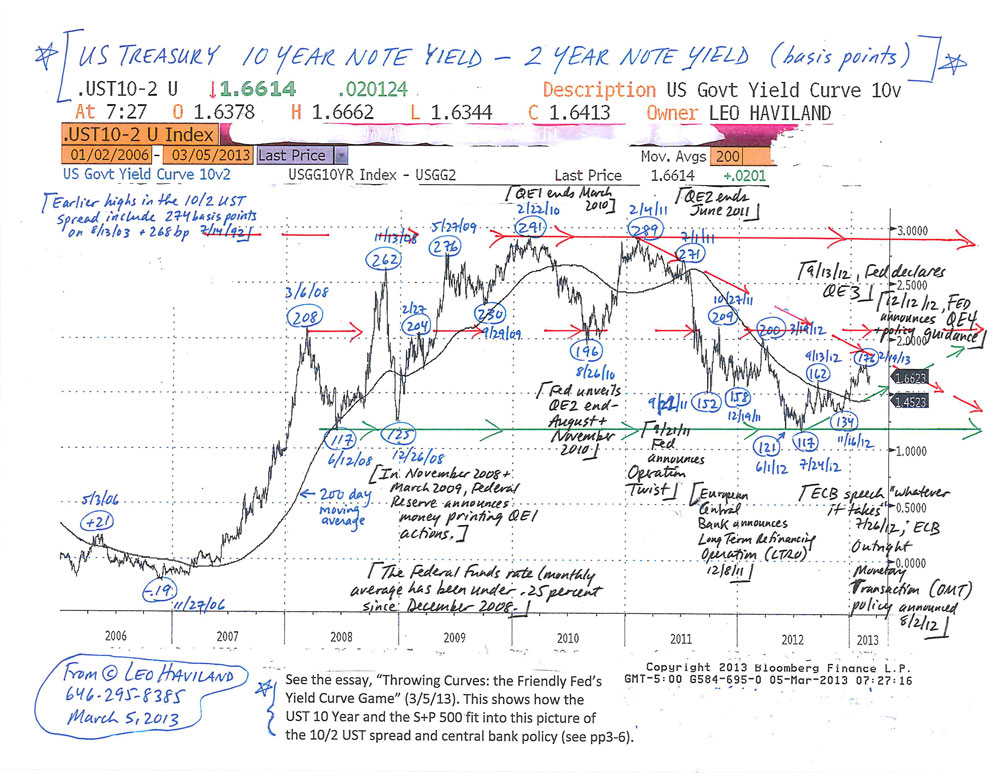
In professional sports such as baseball and Wall Street’s competitive marketplaces, history is not destiny. However, “the past” and variables apparently relevant to it need not be discarded as being of little or no importance, relevance, or guidance for current and future playgrounds. During the worldwide economic crisis that dawned in mid-2007 and the ensuing recovery, noteworthy moves in the 10 year less two year United States government yield spread often have roughly coincided with significant Federal Reserve Board policy decisions (and several months ago with major European Central Bank ones). These US Treasury yield curve ventures (trend changes) generally have occurred around the same time as significant moves in the US Treasury 10 year note and the US stock marketplace (S+P 500). Many lows in the 10/2 UST yield curve spread have tied up with (occurred within a few months of) important S+P 500 bottoms; pinnacles in the spread likewise link up somewhat closely in time with plateaus in the US stock playground.
The UST 10 year less two year spread probably established a major bottom on 7/24/12 at 117 basis points (10 year yield higher than two year return, so a positive yield curve; short rates over long rates creates a negative yield curve).
What would a further notable widening of the spread (steepening of the curve, more positive slope) from current heights around 165 basis points suggest to avid financial marketplace fans? Perhaps a sustained move in this 10/2 UST spread over around 200 to 210 basis points will indicate a renewed (further) strengthening of the US (and worldwide) economic recovery.
However, that upward path over 200/210 basis points instead may warn of impending economic weakness. This viewpoint is not necessarily as off base as some may claim. One needs to focus on whether America is a key source of and significant spark for likely global (not just US) feebleness.
In that regard, recall the shift from 6/12/08’s 117 basis point low (same as 7/24/12’s) up to 11/13/ 08’s 262bp as the financial crisis raced forward (Lehman Brothers bankruptcy 9/15/08). The US housing and financial leverage (banking system) problems were critical issues (though of course not confined to the US), even though the US (and the world in general) did not in mid-2008 yet face major fiscal troubles.
Why might the 10/2 UST spread widen (as in mid-June to mid-November 2008) nowadays or in the near or medium term? In some circumstances, there can be a dismal widening of the UST spread (and higher long term rates) accompanied by little or no economic growth (or even a recession). Suppose the current US (and international) economic horizon darkened significantly. Assume a big fiscal difficulty in the US is a major factor in this bleak outlook. Then maybe this time around, when economic downturn risks in general still loom large, there will not be as nearly as substantial a flight to quality into UST as there was at end 2008 (after mid-November) and as there has been at subsequent economic (downturn) crisis periods since then up to the present time. Thus this setup probably would produce an outcome for the 10/2 yield spread very unlike its pattern during the previous substantial financial deteriorations of the mid-November 2008 to the present time span. Many players (especially international ones) may not view the UST as wonderful quality (especially when nominal yields are so mediocre) if the US may or does become the star of a fearsome fiscal problem and related systemic economic crisis.
Yet the history of the past several years also warns that a slump in the 10/2 UST spread back close to around the July 2012 bottom probably signals US (and global) economic weakness as well.
FOLLOW THE LINK BELOW to download this market essay as a PDF file.
Throwing Curves- the Friendly Fed’s Yield Curve Game (3-5-13)
US Treasury 10 Year versus 2 Year Note Chart (3-5-13)
The Federal Reserve and other central banking all-stars around the globe have teamed up. In varying fashions, and frequently led by the Fed, they vigorously practice accommodative strategies to tackle economic weakness and to spark and sustain economic recovery.
The Fed’s trusty playbook, for example, currently insists on the wisdom of keeping policy (Federal Funds) interest rates pinned to the floor. Much of the UST yield curve offers negative returns relative to inflation. The Fed thus deliberately encourages some American and other yield hunters to avoid, diversify away from, or leave US Treasury debt in search of better returns elsewhere. Many other central banks link arms with the Fed under the low interest rate banner.
Thus many players race into or cart more funds into other debt arenas.
Keep focusing primarily on America for a moment. Those yearning for return trot into domains beyond the interest rate one. If US government yields are going to stay at exceptionally low levels into 2014, why not give stocks an even closer look! Besides, even though not all equities pay dividends, some do. The unending search for yield (return) inspires pilgrims to venture into (or more robustly into) stock marketplaces (use the S+P 500 as a benchmark). Also, surely people have not forgotten the anthem that US stocks are an excellent long run investment.
What are investment, speculation, and gambling? In stocks, interest rates, real estate, and elsewhere, investment rhetoric encourages and often persuades people to embrace a given investment perspective and to act accordingly. Since investment generally is associated with notions such as reasonableness, prudence, and goodness, many people race to be investors (join some investment team) and wear the honored investment crown. And those promoting particular financial instruments compete fiercely to attach an investment label of some sort on what they want others to buy and hold. Thus in recent years, the commodity world has found numerous cheerleaders for concepts that commodities (“in general”) are (can be) an investment, an alternative investment, or an asset class. Think also of the potential diversification benefits for your portfolio of stocks and interest rate holdings. In any event, various assorted commodity investment advocates have won quite a few victories for their ownership cause.
Suppose groundskeeping central bankers mow down the yields of government securities to very low nominal levels (and especially suppose those returns are negative relative to inflation). Those central bankers thereby encourage “investors” in government debt (and those with deposits at bank and money market funds) to seek “investment” returns elsewhere. So why not entertain commodities as a marvelous investment buying opportunity?
FOLLOW THE LINK BELOW to download this market essay as a PDF file.
Commodity Playgrounds- Chasing Returns (2-21-12)
In love and commerce, taking implies giving. On Valentine’s Day and throughout the year, undoubtedly the prudent Federal Reserve remembers the benefits of having and needs of both debtors and creditors. This regulatory chaperone surely would declare that they passionately strive to perform their very best (do what’s most reasonable according to their interpretation of their regulatory duties) for all parties concerned. Besides, they must balance competing interests. Besides again, the Fed has a long run horizon. The Fed’s recent policies nevertheless imply not only an ethics of inflation, but also manifest somewhat greater affection for debtors than creditors.
Japan’s general government gross debt as a percent of its GDP is gigantic, at 241.0 percent for 2012 (IMF, Fiscal Monitor Update, Table 1, 1/24/12). This dwarfs America’s 107.6pc and the Euro area’s 91.1pc. Japan’s general government debt has been huge for several years. How does it keep financing this massive total? And if Japan can keep doing it, doesn’t America really have a lot of room to go (and time to wait)?
Japan may have more domestic savings than America, or be more of a nation of savers from an overall cultural perspective. Japan has run a current account surplus for quite some time, in direct contrast to the bulging United States current account deficit. (See the September 2011 World Economic Outlook, Statistical Appendix, Table A10.)
However, Japan’s ability to accumulate and finance its big general government deficit also may be due to its more favorable treatment of creditors. And despite low interest rates! Creditors of the Japanese government have earned, and have earned for quite some time, a net positive return due to deflation alongside low government interest rates.
So how long will the Fed and US Treasury get away with offering negative (or very low) real returns on US government debt?
FOLLOW THE LINK BELOW to download this market essay as a PDF file.
Sweet Talking, Slick Banking- Federal Reserve Policy (2-14-12)
Relationships of assorted debt instruments to the widely-watched United States Treasury 10 year note offer insight on the American economy’s health. They also offer some guidance regarding stock marketplace signposts such as the S+P 500. Several years of easy money policies and massive deficit spending by the United States and its allies indeed have helped to inflame and propel an American recovery and stock marketplace rally. Because the S+P 500 at around 1300 is nearly double its March 2009 abyss, has the economic crisis that emerged in 2007 almost disappeared, and is a new golden age of prosperity eagerly beckoning? Probably not. These interest rate comparisons confirm that only a fair economic recovery has emerged during the ongoing worldwide economic crisis. These yield relationships also suggest that the S+P 500 faces very strong resistance at its 2011 highs (around 1345/1371), as well as around its May 2008 final top at 1440.
The Federal Reserve’s abiding battle and repeated sweet promises to keep government interest rates resting comfortably near the floor aim to inspire not merely consumer spending and business investment, but also incremental buying in stocks. If, for example, a government two year note pays next-to-nothing in interest, where should we put our money? Stock dividend yields may appear alluring (especially if viewers decide equity prices will not slump much if at all). The fervent search for acceptable returns by many marketplace players sometimes sweeps into other arenas such as corporate notes and bonds, real estate, and alternative “investments” such as commodities. Marketplace voyeurs should ask whether the current quests for “yield” bears at least a passing resemblance to the later scenes of 2006-07 during the gorgeous Goldilocks Era.
FOLLOW THE LINK BELOW to download this market essay as a PDF file.
Spreading It Around- Some US 10 Year Treasury Relationships (1-24-12)