GLOBAL ECONOMICS AND POLITICS
Leo Haviland provides clients with original, provocative, cutting-edge fundamental supply/demand and technical research on major financial marketplaces and trends. He also offers independent consulting and risk management advice.
Haviland’s expertise is macro. He focuses on the intertwining of equity, debt, currency, and commodity arenas, including the political players, regulatory approaches, social factors, and rhetoric that affect them. In a changing and dynamic global economy, Haviland’s mission remains constant – to give timely, value-added marketplace insights and foresights.
Leo Haviland has three decades of experience in the Wall Street trading environment. He has worked for Goldman Sachs, Sempra Energy Trading, and other institutions. In his research and sales career in stock, interest rate, foreign exchange, and commodity battlefields, he has dealt with numerous and diverse financial institutions and individuals. Haviland is a graduate of the University of Chicago (Phi Beta Kappa) and the Cornell Law School.
Subscribe to Leo Haviland’s BLOG to receive updates and new marketplace essays.

The broad range for natural gas (NYMEX nearest futures continuation) over the medium term (extending beyond the balance of this winter 2013-14) remains roughly 280/310 to 490/520. Many players view “around 350” as a near term equilibrium price. Why is there substantial support around 300? Note the 305 low on 1/2/13 (and the gap relative to the 3.046 high on 9/26/12), the 313 lows of 2/15/13 and 8/8/13, and that a 33 percent fall from the 453 high is about 302.
But what about gas prices specifically for the balance of winter 2013-14? Assuming normal weather and moderate American economic growth, the natural gas trend for the remainder of the current draw season probably is about 340 to 453 (the 12/23/13 top; the 5/1/13 high was 444). Inventory from the days coverage perspective has fallen sufficiently to support prices at higher levels than the longer run 280/310 bottom. Around 338 was the 11/5/13 rally take-off point; 340 is a 25pc tumble from the 453 high.
The current low days coverage level of gas inventory nevertheless implies a warning that a break above the December 2013 summit is not out of the question. Suppose (even if this is relatively unlikely) the US suffers through colder than normal weather for the rest of winter 2013-14, and that overall inventories consequently decline significantly relative to average trends. A five percent break over the December 2013 high gives about 476, a 10pc one 499 (498 was the 6/9/11 high. Recall 2010’s 6/16/10 top at 520 and 8/2/10’s around 501; a 50pc rally from the 11/5/13 point is about 507. If severely cold weather is sustained for a rather long time, then six dollars or higher may ensue, even if only on a brief spike. Keep in mind 1/7/10’s 611 pinnacle.
FOLLOW THE LINK BELOW to download this market essay as a PDF file.
US Natural Gas- a Winter’s Tale (1-12-14)
The current bear trend in US natural gas (NYMEX nearest futures continuation basis) that began in late November 2012 at 393 will continue. Assuming normal cold winter weather, the price probably will slump to around the 300 to 285 range. When will the price quit sledding downhill? Though it may only be an initial significant bottom, look for an important low in calendar January or February 2013, probably around futures expiration.
End October 2012 inventories were around 3923bcf according to the EIA barometer (Short-Term Energy Outlook, December 2012; “STEO”). Therefore end October’s 56.3 days of coverage rest about 2.6 days above the 53.7 day long run (1990-2011) average. Though not a big overload relative to that long run average, it is sufficient to place some burden on prices.
Moreover, look at the likely increasing relative oversupply in days coverage terms versus the 1990-2011 average for the given calendar month as time passes from end October 2012 to end March 2013. At end March 2013, forecast inventories of 1873bcf (December STEO, Table 5a) represent about 26.9 days coverage (1873bcf divided by 69.70bcf/d). This jumps about 4.7 days over the 22.2 day long run average for that month, more than October’s 2.6 days.
Suppose end March 2013 inventories are 1800bcf. The excess relative to the long run average is 3.6 days (25.8 less 22.2). This still hovers above the 2.6 day end October 2012 difference.
Despite the ongoing near term downtrend, and absent another very mild winter akin to 2011-12’s, a NYMEX natural gas price collapse close to the 190 abyss of April 2012 (or even the 1/23/12 and 6/14/12 depths near 220) is unlikely.
Based on 2012’s substantial switching from coal to natural gas, particularly in the electric power territory, natural gas demand probably will mount if prices sustain levels beneath (roughly) 275. In addition, another factor probably will mitigate price declines. Concentrate on days coverage holdings in recent years.
The desired level of natural gas inventory holding in recent years arguably has climbed relative to that long run average. Consequently the oversupply of October 2012 through March 2013 probably is less than many observers believe.

FOLLOW THE LINK BELOW to download this market essay as a PDF file.
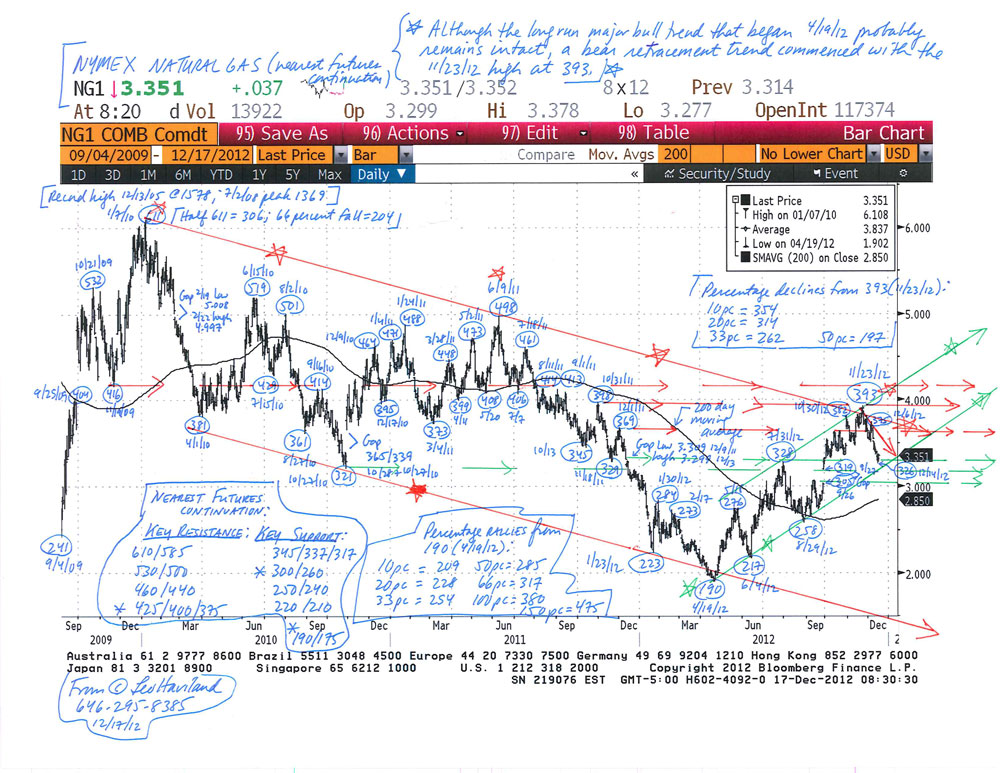
US Natural Gas in Winter 2012-13- Drawing Conclusions (12-17-12)
Natural Gas Chart (NYMEX nearest futures) (12-17-12)