


STEPPING HIGHER: UST TWO YEAR NOTE YIELDS © Leo Haviland September 21, 2014
The US Treasury two year and 10 year notes over the past several years have made many important marketplace turns around the same time. The yield spread relationship between those instruments provides insight into and offers guidance regarding Federal Reserve policies. Although other variables of course are relevant, this spread offers indications regarding the extent of American (and international) economic strength or weakness.
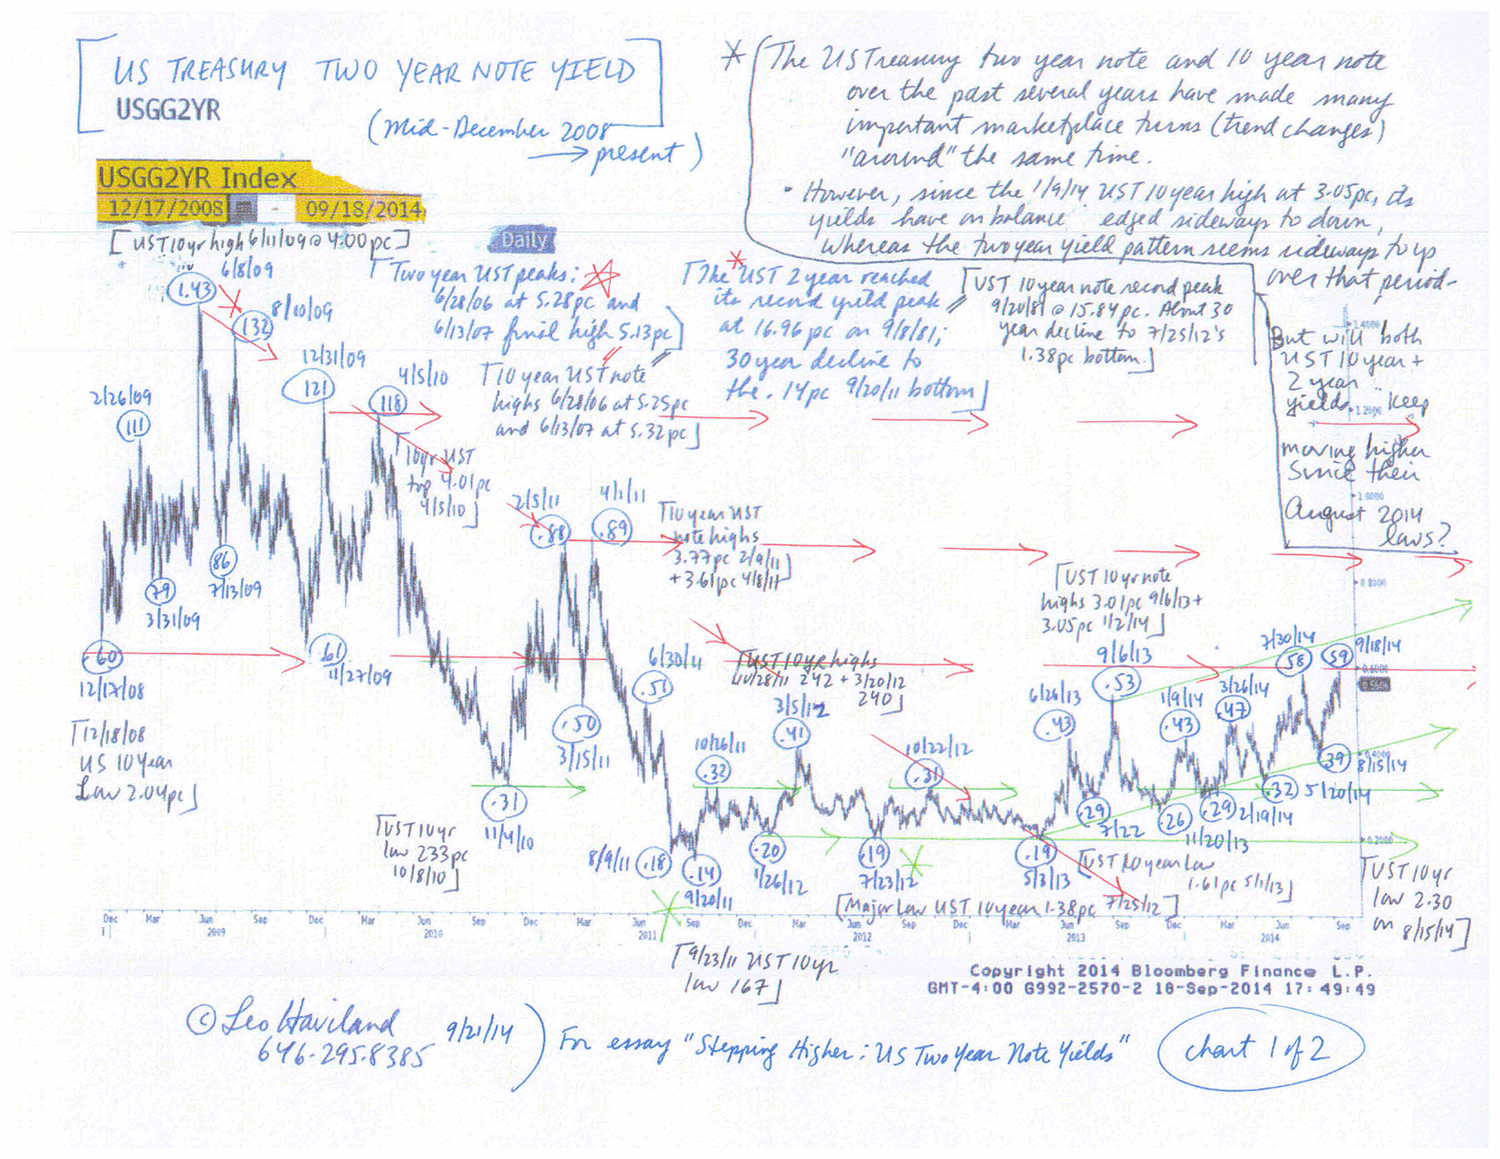
Important trend moves in the 10 year less two year United States government yield spread often have roughly coincided with significant Federal Reserve Board policy decisions (sometimes assisted by major ones by the European Central Bank and others). Especially since around the time of its mid-December 2008 low around 125 basis points (10 year yield higher than two year; a positive yield curve), and thus during the Fed’s yield repression and quantitative easing era, the 10 year less two year spread has tended to widen (become more positive) during times of US economic growth (or notable signs or hopes for it) and decline during times where economic expansion slows or slumps (or when fears rise that this will occur). Fed quantitative easing moves link up with a widening of the yield spread (particularly via boosting the 10 year UST yield). The ending of the Fed’s money printing ventures have tied to narrowing of the yield spread (especially via falls in the UST 10 year yield). A narrowing pattern in this spread and the UST 10 year itself after the ending of QE (including the current tapering round) suggests that noteworthy “underlying” weakness remains in the US economy. See “Bond Yield Perspectives: Easing Comes: Easing Goes” (9/1/14) and related essays.
However, since the UST 10 year’s 1/9/14 plateau at 3.05pc, its yields on balance have moved sideways to down, whereas the two year yield pattern seems sideways to up over that period. The slip in the 10 year yield since then, given the Fed’s determination to increase inflation, indicates less than robust US (worldwide) economic growth. The increase in two year yields may reflect Fed plans more than notable overall economic strength (or the Fed’s faith that such strength is or will soon emerge). Yet will yields for both UST notes keep moving higher since their mid-August 2014 lows?
From the depths of the international economic disaster through most of the succeeding years, these US Treasury yield curve ventures (trend changes) generally have occurred around the same time as significant moves not only in the US Treasury 10 year note but also in the US stock marketplace (S+P 500). Many lows in the 10/2 UST yield curve spread have tied up with (occurred within a few months of) important S+P 500 bottoms; pinnacles in the spread likewise connect somewhat closely in time with plateaus in the US stock landscape.
However, whereas the 10 less two year spread and the 10 year yield itself have declined in recent months (265 basis point high in the yield spread 12/31/13; 3.05pc high on 1/2/14 for the UST 10 year), the S+P 500 this year has ascended to new highs over 2000. Thus the S+P 500’s relationship relative to the 10 less two year spread and the UST 10 year itself seems to have diverged from its prior pattern.
Significantly, the rise in two year note yields since very late 2013/early 2014 contrasts with the fall in the UST 10 year yield and the narrowing of the 10 less two year spread. Since end December 2008, roughly simultaneous declines in the 10 year note yield and the 10 less two year UST spread have been associated with a relatively weak US economic situation (or fears that such feebleness will emerge; international players such as the Eurozone affect this picture).
This slide in the 10 year note and the 10 less two year UST spread connects with the end of Federal Reserve money printing festivals, including the current one. Thus the US may be economically weaker (or more vulnerable to such feebleness) than many marketplace players or even the Fed (judging from its Fed Funds projections) perceives.
Emerging stock marketplaces have not followed the S+P 500 up to record highs. Given the slowing of economic growth in those economies, this represents a warning that the massive bull move in the S+P 500 may not continue forever. Look at the “MSCI Emerging Stock Markets Index” (from Morgan Stanley: MXEF). The MXEF over the past year or so has advanced from lows near in time to those in the S+P 500. Note the MXEF troughs at 878 on 6/25/13, 905 on 8/28/13, and 914 on 2/4/14. However, the MXEF remains below its Goldilocks Era pinnacle at 1345 (11/1/07), as well as 4/27/11’s 1212 plateau. In addition, it has started to fade from its recent top at 1104 on 9/4/14 (despite the ECB’s monetary easing action). If the MXEF starts to step significantly lower (keep an eye on 2/29/12’s high at 1085 and 1/3/13’s one at 1083), that will suggest increasing risks for the S+P 500 (especially if the UST 10 year yield also is unable to breach the 3.05pc level). Renewed weakness in emerging stock marketplaces increases the odds that the continued S+P rally will end (S+P 500 divergence from UST 10 year and 10 less two year trends will cease).
The S+P 500 eventually dropped after QE1 and QE2 ended. Since the current round of US quantitative easing will end in October 2014 (tapering of purchases will finally finish), one should be especially watchful for a reversal (even if it is modest) of the S+P 500’s epic bull trend.
Another sign of sluggish economic growth, particularly in emerging marketplaces, has been the decline in commodities “in general” since spring 2011 (broad Goldman Sachs Commodity Index/GSCI). The GSCI peaked at 762 on 4/11 and 5/2/11. Since then, it generally has displayed a pattern of declining (lower and lower) highs. It recently made an interim top around 673 on 6/23/14, slipping to 582 on 9/15/14.

FOLLOW THE LINK BELOW to download this article as a PDF file.
Stepping Higher- US Two Year Note Yields (9-21-14)
Charts- Two Year UST, 10 Year v 2 Year UST spread (9-21-14, for essay Stepping Higher- UST Two Year Note Yields)