GLOBAL ECONOMICS AND POLITICS
Leo Haviland provides clients with original, provocative, cutting-edge fundamental supply/demand and technical research on major financial marketplaces and trends. He also offers independent consulting and risk management advice.
Haviland’s expertise is macro. He focuses on the intertwining of equity, debt, currency, and commodity arenas, including the political players, regulatory approaches, social factors, and rhetoric that affect them. In a changing and dynamic global economy, Haviland’s mission remains constant – to give timely, value-added marketplace insights and foresights.
Leo Haviland has three decades of experience in the Wall Street trading environment. He has worked for Goldman Sachs, Sempra Energy Trading, and other institutions. In his research and sales career in stock, interest rate, foreign exchange, and commodity battlefields, he has dealt with numerous and diverse financial institutions and individuals. Haviland is a graduate of the University of Chicago (Phi Beta Kappa) and the Cornell Law School.
Subscribe to Leo Haviland’s BLOG to receive updates and new marketplace essays.

Shakespeare proclaims in “As You Like It” (Act II, Scene VII):
“All the world’s a stage,
And all the men and women merely players”.
THE 2016 WORLDWIDE ECONOMIC STAGE
As the 2016 international economic (and political) drama commences, the worldwide economy not only is sluggish, but also feebler than most forecasters assert. International real GDP, as well as that in the United States, has a notable chance of slowing down further than many expect (the International Monetary Fund predicts real global output will increase 3.6 percent in calendar 2016; “World Economic Outlook”, Chapter 1, Table 1.1).
The ability of the Federal Reserve Board, European Central Bank, Bank of England, Bank of Japan, China’s central bank, and their friends to engineer their versions of desirable outcomes via highly accommodative policies has diminished. Beloved schemes such as quantitative easing (money printing) and yield repression and related rhetoric are becoming less influential. Ongoing significant political divisions and conflicts (America’s troubling carnival represents only one example) likely will make it challenging for political leaders to significantly promote substantial (adequate) growth.
The failure of longer term US government yields such as the UST 10 year note to rise substantially despite the Fed’s recent modest boost in the Federal Funds rate represents a noteworthy warning sign regarding American and global financial prospects. Note also very low sovereign yields in much of the Eurozone (picture Germany); Japanese government rates remain near the ground floor. However, yields of less creditworthy debt instruments, whether sovereign or corporate, probably will continue to climb in 2016, another ominous indication.
For the near term at least, the broad real trade-weighted US dollar probably will remain strong. Emerging marketplace equities and commodities “in general” likely will persist in bear trends. What does the rally of the dollar above its late August/September 2015 heights signal? What does the collapse of benchmark commodity indices such as the broad GSCI beneath their late August 2015 lows portend? These warn not only of worldwide economic weakness, but also of further declines in the S+P 500. Note that emerging marketplace stocks hover fairly closely to their 2015 depths. The S+P 500 probably will remain in a sideways to bearish trend.
FOLLOW THE LINK BELOW to download this article as a PDF file.
The Curtain Rises- 2016 Marketplace Theaters (1-4-16)
Federal Reserve Board generals have underlined that they indeed possess an exit strategy for their ongoing extraordinary easing program. Such confident rhetoric regarding an escape plan indeed helps to boost the morale of many economic and political observers of marketplace battlefields. Didn’t its entrance strategy work? The Fed Funds rate has stayed near the ground floor since late 2008, United States Treasury yields have collapsed relative to their 2007 heights, and US equities (use the S+P 500 as a signpost) have soared from their March 2009 abyss.
Yet marketplace combatants should be wary of the Fed’s exit strategy design as well as its tactical implementation. It is not a detailed and finished blueprint. In actual practice, the exit strategy involves significant risk, and it probably will not be put into practice nearly as timely or smoothly as propaganda from the Fed leadership hints. How rapid, coherent, and helpful were the Fed’s policy viewpoints and actions in the early stages of the worldwide economic crisis? As the Fed’s marketplace entrance strategy and maneuvers were very remarkable and evolved over time, why should its exit plan and its application be any more “orderly”?
Yet why should the Fed’s exit strategy be without some significant pain to UST and stock owners? There’s at least a significant risk of notable wounds. After all, the rally in debt and equity prices assisted by the Fed’s massive marketplace easing generally enriched and thus pleased owners of American stocks and UST (and many other debt instruments). Besides, we know the noble Fed is not the only significant policy maker and fighter on the US (and international) economic battlefield. Thus its practical control over marketplace outcomes has significant limits.
To what extent is the Fed Chairman accurate? Is the Fed Chairman trying to minimize the role of the Fed in financing (money printing for) the deficit and to understate potential overall exit strategy issues?
FOLLOW THE LINK BELOW to download this market essay as a PDF file.
Federal Reserve Exit Strategies (2-21-13)
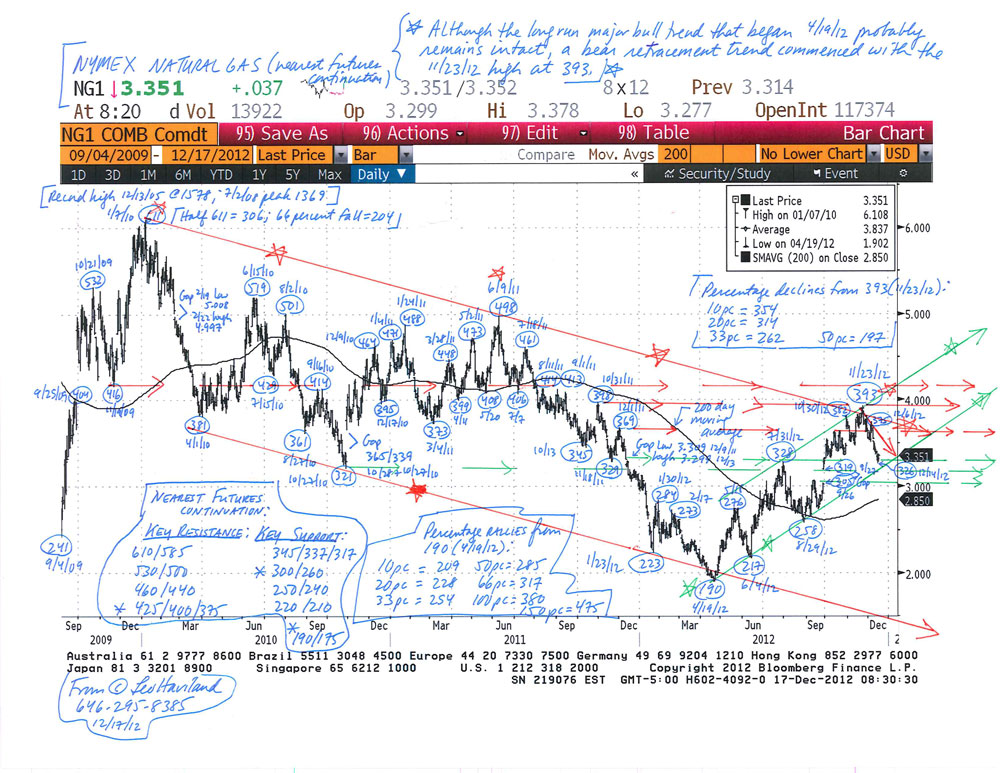
The current bear trend in US natural gas (NYMEX nearest futures continuation basis) that began in late November 2012 at 393 will continue. Assuming normal cold winter weather, the price probably will slump to around the 300 to 285 range. When will the price quit sledding downhill? Though it may only be an initial significant bottom, look for an important low in calendar January or February 2013, probably around futures expiration.
End October 2012 inventories were around 3923bcf according to the EIA barometer (Short-Term Energy Outlook, December 2012; “STEO”). Therefore end October’s 56.3 days of coverage rest about 2.6 days above the 53.7 day long run (1990-2011) average. Though not a big overload relative to that long run average, it is sufficient to place some burden on prices.
Moreover, look at the likely increasing relative oversupply in days coverage terms versus the 1990-2011 average for the given calendar month as time passes from end October 2012 to end March 2013. At end March 2013, forecast inventories of 1873bcf (December STEO, Table 5a) represent about 26.9 days coverage (1873bcf divided by 69.70bcf/d). This jumps about 4.7 days over the 22.2 day long run average for that month, more than October’s 2.6 days.
Suppose end March 2013 inventories are 1800bcf. The excess relative to the long run average is 3.6 days (25.8 less 22.2). This still hovers above the 2.6 day end October 2012 difference.
Despite the ongoing near term downtrend, and absent another very mild winter akin to 2011-12’s, a NYMEX natural gas price collapse close to the 190 abyss of April 2012 (or even the 1/23/12 and 6/14/12 depths near 220) is unlikely.
Based on 2012’s substantial switching from coal to natural gas, particularly in the electric power territory, natural gas demand probably will mount if prices sustain levels beneath (roughly) 275. In addition, another factor probably will mitigate price declines. Concentrate on days coverage holdings in recent years.
The desired level of natural gas inventory holding in recent years arguably has climbed relative to that long run average. Consequently the oversupply of October 2012 through March 2013 probably is less than many observers believe.

FOLLOW THE LINK BELOW to download this market essay as a PDF file.
US Natural Gas in Winter 2012-13- Drawing Conclusions (12-17-12)
Natural Gas Chart (NYMEX nearest futures) (12-17-12)