GLOBAL ECONOMICS AND POLITICS

Leo Haviland provides clients with original, provocative, cutting-edge fundamental supply/demand and technical research on major financial marketplaces and trends. He also offers independent consulting and risk management advice.

Haviland’s expertise is macro. He focuses on the intertwining of equity, debt, currency, and commodity arenas, including the political players, regulatory approaches, social factors, and rhetoric that affect them. In a changing and dynamic global economy, Haviland’s mission remains constant – to give timely, value-added marketplace insights and foresights.

Leo Haviland has three decades of experience in the Wall Street trading environment. He has worked for Goldman Sachs, Sempra Energy Trading, and other institutions. In his research and sales career in stock, interest rate, foreign exchange, and commodity battlefields, he has dealt with numerous and diverse financial institutions and individuals. Haviland is a graduate of the University of Chicago (Phi Beta Kappa) and the Cornell Law School.


Subscribe to Leo Haviland’s BLOG to receive updates and new marketplace essays.

RSS View Leo Haviland's LinkedIn profile View Leo Haviland’s profile


CHINA: BEHIND THE GREAT WALL (c) Leo Haviland June 7, 2016

“Seek truth from facts.” Mao Zedong and Deng Xiaoping

CONCLUSION

China’s era of miraculous economic growth has marched into history. Yet China’s real GDP output in the past few years, and even 2015, has been robust in comparison to that of most other nations. The majority of international financial wizards faithfully proclaim that Chinese GDP likely will remain strong, at over six percent for the next several years.

China’s GDP strength over the past three or four years nevertheless derived significantly from its widespread national willingness to boost debt (leverage) levels substantially. This significant debt expansion coincides with the current unwillingness or inability of the nation’s political and economic leadership to do much to subdue the debt issue. China’s continued debt building (perhaps assisted by other factors) perhaps will achieve its praiseworthy growth levels, at least for a while.

And trend shifts during first quarter 2016 in various stock (both advanced and emerging), interest rate, currency, and commodity marketplaces (particularly dramatic rallies in the S+P 500 and the petroleum complex) inspire optimism regarding global growth prospects. Despite potential for small rate increases by the widely-admired Federal Reserve, monetary policy in America and elsewhere likely will remain highly accommodative, thereby assisting expansion in developed nations and China.

****

However, review the patterns in China’s stock, central government 10 year note, and currency marketplaces. Those domains, when interpreted together and alongside a broad array of other key global financial marketplaces, not just the S+P 500 and oil, on balance nowadays suggest Chinese growth over the next few years probably will be less than most gurus expect. In today’s interconnected economic world, slower than anticipated Chinese economic expansion probably will be reflected by more sluggish growth elsewhere than generally forecast.

Politics and economics entangle in both advanced and emerging/developing nations. China’s political elite (notably its Communist party chiefs) seeks to ensure its own power and overall national political, economic, and social stability. Insufficient GDP growth and related widespread popular fears regarding income levels and economic inequality probably endangers these goals.

What do the political rhetoric and actions over the past few years (including recently) by China’s leaders reflect? Quite significantly, they portray increasing concern about their nation’s current and prospective economic situation, particularly its growth level and outlook.

To deflect and dilute growing popular concern about a weakening economic situation (slowdown; feebler growth than desired), and to maintain their political power and influence, China’s political leaders have acted vigorously on both the external and internal fronts. In the foreign sphere, they increasingly quarrel with other nations; on the internal landscape, efforts to control political and other social activities and dialogue have increased. These policies from China’s authorities tend to confirm the trends of slowing Chinese (and global) growth.

FOLLOW THE LINK BELOW to download this article as a PDF file.
China- Behind the Great Wall (6-7-16)

DÉJÀ VU (ENCORE): US MARKETPLACE HISTORY © Leo Haviland October 4, 2015

CONCLUSION 

Via its rhetoric and September 2015 managerial decision to delay a Fed Funds rate increase, the Federal Reserve has battled to halt the S+P 500’s decline relative to its May 2015 peak at around ten percent. Hints by the European Central Bank and Japanese policymakers regarding their potential willingness to embark on additional quantitative easing interrelate with this Fed quest. However, the International Monetary Fund head warns: “global growth will likely be weaker this year than last, with only a modest acceleration expected in 2016”; “we see global growth that is disappointing and uneven” (“Managing the Transition to a Healthier Global Economy”; 9/30/15). The World Trade Organization cut its 2015 forecast of global trade expansion from 3.3 percent to 2.8pc, lowering that for 2016 to 3.9pc from 4.0pc (9/30/15). The WTO says risks to this prediction are on the downside.


Worldwide economic growth probably will be feebler than the IMF expects. In today’s intertwined international economy, this overall economic weakness, which is not confined to emerging/developing nations, will help to undermine American GDP growth. The S+P 500 will remain volatile, but it probably will continue to decline, eventually breaking beneath its August 2015 low. The broad real trade-weighted United States dollar will stay relatively strong.


Marketplace history for US stocks and other financial domains obviously need not repeat itself, either in whole or in part. A slump in the S+P 500 of roughly twenty percent or more from its spring 2015 pinnacle nevertheless probably would inspire memories of 2007-09. After all, not only is the dollar strong, but also emerging marketplace stocks and commodities “in general” have collapsed over the past few years, and notably since second half 2014.


The strong US dollar, the substantial tumble in emerging stock marketplaces, and the crash in commodities in general reflect (confirm; encourage) global economic weakness (slowing growth). Overall debt levels as a percentage of nominal GDP in America (and many other places) remain elevated despite the economic recovery since 2009. The United States has made no progress in reducing its long run federal fiscal deficit problem. These trends are ominous bearish indicators for the S+P 500. What other variables currently or potentially confirm the probability of economic weakness in the US (and elsewhere)? Let’s focus on the US economic and political scene.

****

The broad real trade-weighted US dollar (“TWD”) established a major bottom at 80.5 in July 2011 (Federal Reserve, H.10; monthly average). By September 2015, it had run up to 97.9. Not only does September 2015 exceed March 2009’s 96.9 high, attained at the depths of the worldwide economic disaster (and alongside the S+P 500’s March 2009 major low at 667). The TWD’s 21.6 percent appreciation in its current bull move exceeds the 15.1pc TWD advance during from April 2008 to March 2009. Keep in mind that although the S+P 500’s major high in October 2007 at 1576 preceded April 2008’s TWD trough, its 5/19/08 final top at 1440 roughly coincided with that April 2008 TWD low.

****

Review Moody’s Baa index of corporate bonds (this signpost includes all industries, not just the industrial sector; average maturity 30 years, minimum maturity 20 years; Federal Reserve, H.15). Despite the Fed’s continued unwillingness to raise the Federal Funds rate, such yield repression in recent months has not prevented the modest yet rather steady rise in medium-grade US corporate debt yields. In addition, the yield spread between that corporate debt index and the 30 year US Treasury bond has widened. Although these rate moves have not shifted as dramatically as they did during the worldwide financial crisis, they likewise warn of (confirm) US (and global) economic weakness.

****

FOLLOW THE LINK BELOW to download this article as a PDF file.
Deja Vu (Encore)- US Marketplace History (10-4-15)

EUROZONE: RUNNING IN CIRCLES © Leo Haviland November 18, 2013

Nevertheless, although the Euro Area “in general” is not entirely out of gas and running on empty, it is running in place. Its economic performance for the next few years probably will be sluggish. There will be little or no economic growth, general government debt will remain quite high, and unemployment will stay very lofty.

The Eurozone economy is going nowhere fast on the road to recovery. Of course differences between individual nations exist; Germany is not Greece.

For the stock arena, take the SXXP index of 600 European stocks (though it includes United Kingdom and other non-Euro Area companies) as a benchmark (Bloomberg symbol is SXXP). This vehicle, like America’s S+P 500, has not moved in a sideways pattern, but instead has (despite some sharp twists and turns) flown sky-high since its 3/9/09 major low at 155.4 (S+P 500 major trough 3/6/09 at 667). The bottom line is that the probable path of European equities probably is closely bound with that of American stocks.

With the SXXP now around 325.0, what’s the rundown on some SXXP levels to monitor? Recall 332.9, the 5/19/08 high. The final top in the S+P 500, after its 10/11/07 pinnacle at 1576, also occurred 5/19/08 (at 1440). If prices fall from current levels, note that twice the 3/9/09 bottom is 310.8; keep an eye on 2/18/11’s 292.2 if prices stumble further. Unlike the S+P 500, the SXXP has not escaped above its 2007 peaks. Are prices for European equities circling back to their former record heights? In any event, if European stock prices venture even higher from current levels, watch 10/11/07’s summit at 391.3 and the major pinnacle of 401.0 on 7/13/07.
11-18

FOLLOW THE LINK BELOW to download this market essay as a PDF file.
Eurozone- Running in Circles (11-18-13)
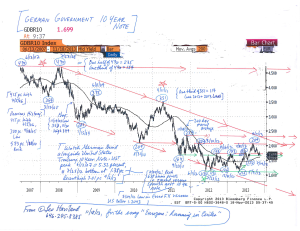
Chart- German Govt 10 Year Note (for essay, Eurozone- Running in Circles) (11-18-13)

CASH AND CAPITAL CACHES © Leo Haviland, March 6, 2012

Everyone knows that money shifts into, within, and between geographic regions and broad financial sectors (stocks, interest rates, foreign exchange, commodities, real estate) sometimes are substantial or even “dramatic”. Price movements and other statistics indicate this. However, seldom is it underlined how gigantic capital marketplaces are.

Would it matter much if American stocks weakened on a sustained basis around ten percent? Such an US equity decline is a noteworthy absolute sum and large from the GDP and net worth perspective as well. US stock marketplace capitalization at end 2010 was $17.3 trillion. Suppose one uses 2011 US GDP at around $15.1tr (Bureau of Economic Analysis; the 2010 level in the IMF table is $14.5tr). A ten percent equity dive equals about 11.5pc of GDP (1.73/15.1 trillion).

Take another view using Federal Reserve data. According to the Federal Reserve’s “Flow of Funds” (Z.1, Tables B.100.e and B.100; 12/8/11, next release 3/8/12) 2Q11’s equity shares for households (and nonprofit organizations) were about $19.2tr. A ten percent equity dive equals around 12.7pc of GDP (1.92/15.1). End February 2012 US stock valuations probably are roughly around that 2Q11 total. A ten pc slump in stocks (using US equities as the benchmark for all stock holdings by US households) of $1.92tr equals around 12.7pc of 2011 nominal GDP (1.92/15.1), or around 3.2 percent of 2Q11’s household net worth of just under $60 trillion (3Q11 $57.4tr is most recent Z.1 information). US end 3Q11 household net worth still remains beneath end 2007’s over $65.1tr.

With consumers around 70 percent of the US economy, the Fed’s assorted accommodative monetary policies during the ongoing worldwide economic crisis that emerged in 2007 have sought to boost (and sustain rallies in) equity prices.

However, what does the fairly strong TWD in 1Q09 versus its April 2008 trough alongside the absence of any significant increase in the percentage of worldwide US dollar holdings over that time span indicate? It strongly suggests that something more may have been going on in (“behind”) these official reserve patterns than the consequences of US dollar appreciation. A reasonable conjecture is that it reflects a determination by developing/emerging nations in general not to expand their exposure to the US dollar. Given the longer run trend of their declining US dollar claims, they even arguably are trying to reduce their US dollar claims regardless of dollar fluctuations.

Note the recent coincidence in time of a bottoming of yields in the “flight to quality” destination. Compare the 10 year government notes of the United States, Germany, and Japan. Recent UST 10 year note lows were 1.67pc on 9/23/11 and 1.79pc on 1/31/12. The Japanese JGB 10 year low was 1/16/12 at .94pc (compare JGB bottoms at .83pc 10/7/10, .44pc 6/11/03, and .72pc 10/2/98). The German 10 year government note valley at 1.64pc on 9/23/11 was the same day as the UST note one. It made another trough at 1.74pc on 1/13/12 (about the time of Japan’s mid January 2012 low), as well as one at end January (1.78pc on 1/31/12; compare US 10 year).

Suppose there is some inflation, and that low nominal yields result in very low real (or even negative) yields. In the absence of another round of flight to quality concerns, how eager will official and private players be to own (or at least to be substantial net purchasers going forward) of government debt of these nations?

FOLLOW THE LINK BELOW to download this market essay as a PDF file.

Cash and Capital Caches (3-6-12)