GLOBAL ECONOMICS AND POLITICS
Leo Haviland provides clients with original, provocative, cutting-edge fundamental supply/demand and technical research on major financial marketplaces and trends. He also offers independent consulting and risk management advice.
Haviland’s expertise is macro. He focuses on the intertwining of equity, debt, currency, and commodity arenas, including the political players, regulatory approaches, social factors, and rhetoric that affect them. In a changing and dynamic global economy, Haviland’s mission remains constant – to give timely, value-added marketplace insights and foresights.
Leo Haviland has three decades of experience in the Wall Street trading environment. He has worked for Goldman Sachs, Sempra Energy Trading, and other institutions. In his research and sales career in stock, interest rate, foreign exchange, and commodity battlefields, he has dealt with numerous and diverse financial institutions and individuals. Haviland is a graduate of the University of Chicago (Phi Beta Kappa) and the Cornell Law School.
Subscribe to Leo Haviland’s BLOG to receive updates and new marketplace essays.

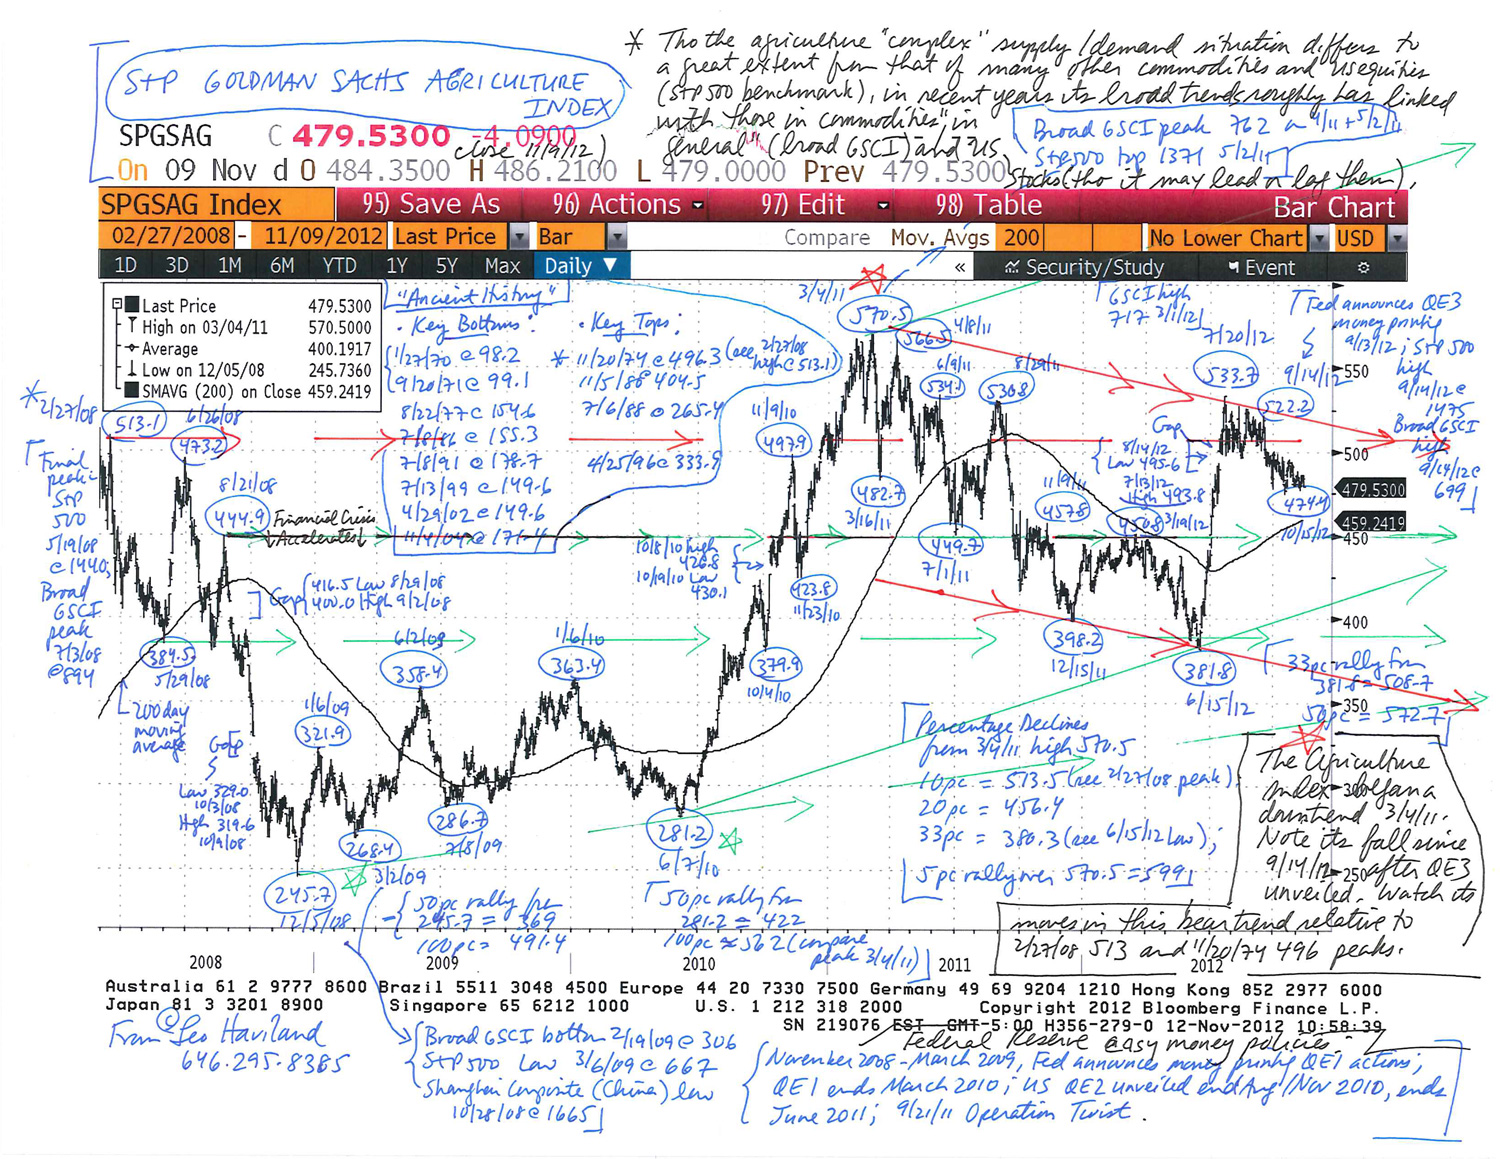
Regarding the S+P Goldman Sachs Agriculture Index (11/12/12):
Thus in recent years, some major trends in the Goldman Sachs Agriculture Index have paralleled those in the broad GSCI and US stocks (S+P 500). There of course have been leads (lags) in the timing of major price turns between the GS Ag Index and the broad GSCI and the S+P 500.
Despite a rally to the 7/20/12 plateau at 534, the recent failure of the Ag Index to sustain a move over the 2/27/08 summit around 513 and the 496 peak of almost 40 years ago (11/20/74; also see the price gap in summer 2012 around that 496 level) is a bearish sign. So is the Ag Index’s erosion since- and despite- the Federal Reserve’s announcement of QE3 money printing on 9/13/12. Since 9/14/12, note the similar slumps in the S+P 500 and the broad GSCI.
Chart Analysis- Goldman Sachs Agriculture Index (11-12-12)
Regarding metals marketplaces (“Metals, Marketplaces, and Meltdowns”, 11/8/12):
In 2011, key base and precious metals began bear trends. Take a look at the attached charts. Though different metals commenced their descents at various times, they all have fallen. Even gold has not surpassed its 9/6/11 top at 1921.
The Federal Reserve unveiled a third round of money printing 9/13/12. However, unlike what occurred after QE1 and QE2, US stocks (S+P 500 and Dow Jones Industrial Average) have not sustained an advance. Stock and commodity bulls might argue that only a few weeks have passed since mid-September. Nevertheless, the S+P 500 (9/14/12 at 1475) and Dow Jones Industrial Average (10/5/12 at 13662) made highs and then slumped. Declines in gold, silver, and the London Metal Exchange’s LMEX Index (and Brent/NSea and NYMEX crude oil) coincide with the 9/14/12 to 10/5/12 top in stocks.
In recent years, price and time trends of commodities “in general” and stocks have roughly mirrored (“confirmed”) each other. Thus the weakness in the overall metals complex is a noteworthy bearish warning sign for US (and “related”) equity marketplaces.
Read the rest of this entry »
The long running bull march in the Japanese Yen from early summer 2007 to the current time generally coincides with a continuing worldwide economic crisis. The Yen’s robust strength mirrors the failure by central bankers and politicians around the globe to cure the lamentable financial ills. National policies often differ. The international guardians frequently coordinate their rescue and stimulus programs. Yet measures such as deficit spending, money printing, efforts to keep government interest rates near the floor, and struggles to maneuver currency rates merely have patched and postponed severe problems, not genuinely repaired them. Worrisome debt and leverage issues revealed in 2007-08 lurk on in various forms.
The rally in the Japanese Yen on an effective exchange rate basis since around July 2011 warns that an acceleration of the worldwide crisis, as in mid-2008, may be underway or very near to commencing. Significantly, the climb in the Yen cross rate versus the US dollar since mid- March 2012 also fits the ongoing international economic weakness story. Recall that as the world economy deteriorated more and more quickly around mid-2008, not only did the US dollar rally on a broad real trade-weighted basis, but also the dollar weakened relative to the Yen. The strong dollar equals weak stocks (and weak commodities in general), weak dollar equals strong equities (and bullish commodities) chant remains popular.
The world and perspectives on it are not immutable, so 2012 does not precisely duplicate 2008. Yet given the experience of 2008, what does a rally by the dollar in general, if accompanied by a rally in the Yen (effective exchange rate), and especially if the Yen also marched higher against the dollar on a cross basis, portend? This would hint that the disturbing international crisis is in the process of becoming more fearful. And since March 2012, that seems to be what has been happening.
The current dangerous situation in the ongoing worldwide economic crisis, if it further worsens (and it probably will worsen to some extent, even if the deterioration is not nearly as severe as in 2008), will be sufficiently severe to induce policy makers around the globe to take further substantial steps in their struggles to provide long-lasting remedies. Perhaps such actions by central bankers and political leaders may occur relatively soon. These may issue from individual nations in somewhat piecemeal fashion. Yet there is a substantial chance that intervention will be relatively coordinated, especially if an encore of second half 2008 looks more and more to be underway.
But in the meantime, for the near term, the Japanese Yen probably will keep rallying on an effective exchange rate basis; it probably will breach the 1/16/12 daily low of 187.5. The Yen likely will retest the Y75 level against the dollar. However, the US dollar (TWD) will remain fairly strong. The bear trend in worldwide equities and commodities in general therefore probably is not over. Renewed sustained weakness in both the Yen and the dollar would indicate an easing of the current stage of the global crisis.
FOLLOW THE LINK BELOW to download this market essay as a PDF file.
2008 Revisited- Japanese Yen Strength, Global Economic Weakness (6-4-12)
Crude oil streams and various refined products create an array of petroleum supply/demand pictures. Although America of course is not the entire oil universe, a survey of the recent overall United States petroleum inventory scene offers insight into the general petroleum price trend. Also recall the linkage in recent years of major trends between the S+P 500 and the petroleum complex (and commodities “in general”). This analysis of petroleum inventories in context underlines the current bearish trends in petroleum and the S+P 500.
At end March, US oil industry total inventory averages 50.3 days coverage (1996-2011, crude and products combined relative to total product supplied per day for that calendar month, Energy Information Administration inventory data; Strategic Petroleum Reserve stocks not included). End March 2012 days coverage climbed to 58.9 days supply. Not only did this soar more than eight days above average. It established a new record for that calendar month for the 1996- present era. Although the United States economy has been in a recovery for almost three years, these inventories broke beyond March 2009’s 58.2 day summit, achieved in the depths of the worldwide economic crisis and the month of the S+P 500’a major low (3/6/09 at 667).
These high supplies for March 2012 are not a one month aberration. Glance at the previous three months in historical context. From 1996 through end 2011, average total inventory for December is 50.2 days, January 51.0 days, and February 50.0 days. December 2011 ascended to a new record high for that calendar month; its 56.3 days of supply decisively beat 1998’s 55.4 days. What about January 2012? Not only is its 58.9 days coverage about eight days above average. They smash January 2010’s top of 56.8 days (compare January 2009’s lofty 55.8 days). February 2012’s 57.9 days coverage likewise significantly exceeds its calendar month average. Its huge days coverage decisively climbs over the previous stockpile record of 56.9 days achieved in February 2009.
As of 4/27/12 (weekly EIA data), US petroleum industry inventory slipped to around 56.9 days of supply (average daily total product supplied for the most recent four weeks). Total oil industry stocks nevertheless remain ample from the days coverage perspective. Although not a new end April record elevation (2009 was 58.8 days), it still vaults more than five days over end April’s 51.5 days coverage average.
On balance, just-in-case fears regarding petroleum inventory probably are diminishing, and will continue to do so for a while longer. A bear trend in petroleum prices probably also will interrelate with attitudes regarding just-in-case inventory management. If prices are dropping, why worry quite so much about supplies, right? ****
Analysis of NYMEX noncommercial petroleum positions indicates they probably reached a peak recently. Liquidation by net noncommercial longs probably has helped to move oil prices lower and probably will continue to do so.
FOLLOW THE LINK BELOW to download this market essay as a PDF file.
Petroleum- Taking Stock (5-8-12)
NYMEX Crude Oil (5-8-12)
The onset and acceleration of vicious bear trends in base metals “in general” such as copper in 2007 and 2008 preceded or coincided with meltdowns in other stock and many other commodity marketplaces. In late 2008, the London Metal Exchange’s base metal index’s bottom dawned only about three months before the major low in the S+P 500. What about 2011? Base metals reached their 2011 summits, as during the early stage of the global economic disaster, around the time of those in the S+P 500.
Erosion in base metal prices, especially as it now coincides with tumbles in stock arenas and in many other commodity playgrounds and some strength in the battered US dollar, confirms and points to further worldwide economic weakness. These intertwined marketplace trends underline that America’s policy actions (and related ones by many other nations) such as gigantic deficit spending, massive money printing, and sustained rock-bottom government interest rates have not sufficiently solved the severe debt and leverage problems that emerged into view in 2007 and 2008.
Although a repeat of the massive price declines of 2008 are unlikely, the current bear trends of 2011 in base metals probably will continue, as will those in equities and many other commodities.
The linkage of the base metal complex to stock marketplace and US dollar moves and interest rate policies and trends underscores the benefits of paying close attention to base metals. There has been a close bond in recent years between trends in the S+P 500, commodities “in general”, and the United States dollar. For example, in 2007, the LMEX major high on 5/4/07 at 4557 preceded the S+P 500 plateau on 10/11/07 at 1576. Eventually the crucial 2008 final tops in various marketplaces arrived. Note the timing coincidence in the final highs in the LMEX (3/5 and 7/2/08), the low in the broad real trade-weighted dollar (April 2008), the final top in the S+P 500 (5/19/08, midway between the LMEX 2008 tops), and the broad Goldman Sachs Commodity Index (7/3/08). Compare the 2011 timing coincidence in tops in these various marketplace domains. For example, the LMEX high on 2/14/11 at 4478 is very close in time to the initial S+P 500 top on 2/18/11 at 1344; compare 4/18/11’s 4469 LMEX high with the S+P 500 peak on 5/2/11 at 1371.
FOLLOW THE LINK BELOW to download this market essay as a PDF file.
Metals and Meltdowns (9-26-11)