GLOBAL ECONOMICS AND POLITICS

Leo Haviland provides clients with original, provocative, cutting-edge fundamental supply/demand and technical research on major financial marketplaces and trends. He also offers independent consulting and risk management advice.

Haviland’s expertise is macro. He focuses on the intertwining of equity, debt, currency, and commodity arenas, including the political players, regulatory approaches, social factors, and rhetoric that affect them. In a changing and dynamic global economy, Haviland’s mission remains constant – to give timely, value-added marketplace insights and foresights.

Leo Haviland has three decades of experience in the Wall Street trading environment. He has worked for Goldman Sachs, Sempra Energy Trading, and other institutions. In his research and sales career in stock, interest rate, foreign exchange, and commodity battlefields, he has dealt with numerous and diverse financial institutions and individuals. Haviland is a graduate of the University of Chicago (Phi Beta Kappa) and the Cornell Law School.


Subscribe to Leo Haviland’s BLOG to receive updates and new marketplace essays.

RSS View Leo Haviland's LinkedIn profile View Leo Haviland’s profile


US ELECTION 2016: ROLLING AND TUMBLING © Leo Haviland November 6, 2016

Muddy Waters’ blues song “Rollin’ and Tumblin’” declares:
“Well, I rolled and I tumbled, cried the whole night long
Well, I woke up this mornin’, didn’t know right from wrong”

****

OVERVIEW

Who will or should be the next American President? Will the Democrat camp, the Republican crew, or neither party, capture both the Senate and the House of Representatives? In the aftermath of 2016’s fevered campaign, will the apparently defeated Presidential candidate seriously complain of rigging or request recounts?

In any case, America’s Election Day 11/8/16 results probably will not repair, remedy, or resolve the nation’s severe political and other cultural divisions. In contrast to such ideological and practical splits, marketplace preachers generally agree the Presidential (especially) and Senate/House voting outcomes probably will have important price consequences for American (and related) stock and interest rate arenas as well as the United States dollar and many commodities. Yet financial wizards (as do politicians) differ in their perspectives and gospels. Thus assorted monetary apostles and their devoted partisans nevertheless heatedly debate what the near term and long run financial and other economic repercussions of US Election 2016 will be for America and around the globe.

Despite the uncertainty of US 11/8/16 political outcomes and the variety of competing viewpoints and rhetoric regarding related economic (commercial, financial) implications, why not offer an opinion regarding important price levels to watch in several key marketplaces? That price framework offers subjective guidance for monitoring, assessing, and dealing with intertwined political and economic results, trends, and risks.

****

The record high for the S+P 500 is 8/15/16’s 2194 (a 20pc rally from 2/11/16’s bottom at 1810 is 2172; 1/20/16 low 1812). A five percent rally over this is about 2304. The important 5/20/15 high was 2135. A five percent fall from 8/15/16’s plateau is 2084 (note 11/4/16’s close at 2085); 2082 was 12/19/15’s notable drop-off point. A 10pc retreat from the August 2016 summit gives 1975 (1992 was the 6/27/16 low; the UK held its Brexit referendum on 6/23/16), and a 20pc dive 1755. Note the price gap around 2040 (6/28/16 to 6/29/16). Support also may emerge around 1870 (8/24/15 low 1867; 9/29/15 trough 1872).

The shocking Brexit “Leave” result did not merely reflect populist gains. The S+P 500 responded with a sharp (although brief) 5.7pc breakdown (6/23/16 at 2113 to 6/27/16’s low).

PARTING SHOTS

“Here once the embattled farmers stood,
And fired the shot heard round the world.” Ralph Waldo Emerson’s “Concord Hymn” (1837), referring to the first shot of the American Revolutionary War

****

Though America’s official Thanksgiving Day arrives 11/24/16, many Americans and others will be thankful with the departure of Election Day 11/8/16.

Suppose Clinton wins the Presidency. Her campaign proposals include increasing taxation on the top-earning “haves” and a more burdensome capital gains tax regime. Suppose Trump triumphs. Most experts believe his tax and spending proposals, if enacted, will result in massive budget deficits. And whoever prevails, a substantial potential for ongoing sectarian conflict and legislative gridlock remains.

Most cultural observers would characterize Clinton’s victory as one for the “establishment” congregation. Some would deem a Trump win revolutionary (or reactionary). In any case, the widespread support for Trump and Sanders indicates that American “populist” viewpoints, whether within the so-called right wing/conservative domain or the left wing/liberal realm, probably will not lose much of their attractiveness or fervor anytime soon.

Besides, significant populist movements (whether rightist, leftist, or some other label) exist in Europe and elsewhere. Therefore populist enthusiasm probably will continue to cause some nervous days and sleepless nights for much of the international economic and political establishment (elite). Political and economic divisions, turmoil, and fears will continue to produce occasional dramas within entangled stock, interest rate, currency, and commodity (and real estate) marketplaces.

Suppose persuasive populist parties campaigning on a platform of “Change” win overall national power (or at least substantial practical influence) in one or more key countries. To what extent would such success encourage or confirm a dramatic shift in long run patterns for many marketplaces?

FOLLOW THE LINK BELOW to download this article as a PDF file.
US Election 2016- Rolling and Tumbling (11-6-16)

US NATURAL GAS: ON THE ROAD © Leo Haviland August 2, 2015

The probable avenue for the United States natural gas marketplace (NYMEX nearest futures continuation basis) for the next several months is a range between 2.15 and 3.40. The major bear trend that followed 2/24/14’s major peak at 6.493 attained a key bottom with 4/27/15’s 2.443 low. Was this a major low? Perhaps, but prices probably will challenge that level again and perhaps modestly break it over the next several months.

But why? After all, assuming normal weather, current and anticipated upcoming natural gas days coverage through winter 2015-16 tend to support prices, particularly in the context of NYMEX natural gas prices well under 4.00. Historical analysis indicates the bear trend from February 2014 to April 2015 travelled sufficiently far in price and duration terms to justify a shift to a neutral to bullish outlook. Also, the last prior major low, 1.902 on 4/19/12, likewise occurred in calendar April. Many key bottoms have occurred around contract expiration. In addition, many significant marketplace trend changes in natural gas (and petroleum) roughly coincide with very elevated net long or short noncommercial positions. From the historical perspective, the net noncommercial short position was very large around the time of April 2015’s low; the net noncommercial length likewise was substantial around the time of the February 2014 peak.

Natural gas prices often travel substantially independently of both petroleum (and commodities “in general”) and so-called “international” or “financial” factors. However, especially since mid-to-late June 2014 and into calendar 2015, bearish natural gas price movements have intertwined with those in the petroleum complex and the bull move in the broad real trade-weighted US dollar. The retreats since their spring 2015 highs in the commodities complex in general and petroleum in particular fit with similar slumps in natural gas. Petroleum likely will remain weak and the US dollar will remain strong for the near term, which will be bearish factors for American natural gas prices.

Quite a few marketplace observers believe the US natural gas marketplace will have massive inventories at the end of calendar 2016 build season (end October). This bearish perspective also weighs on prices. Although such oversupply probably will not occur (assume normal weather), such views are not unreasonable.

FOLLOW THE LINK BELOW to download this article as a PDF file.
US Natural Gas- On the Road (8-2-15)

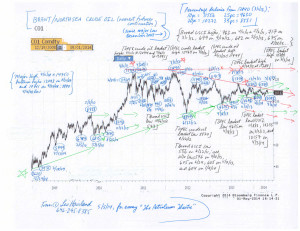
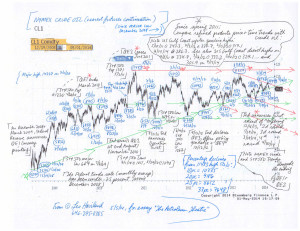
THE PETROLEUM THEATRE © Leo Haviland May 5, 2014

The worldwide petroleum marketplace “in general” will continue its sideways to down trend.

Despite modest global economic growth and forecasts by leaders such as the International Monetary Fund for further expansion, despite sustained highly accommodative monetary policy by the Federal Reserve Board and its allies, look at petroleum price benchmarks such as NYMEX and ICE Brent/Sea crude oil contracts (nearest futures continuation), as well as at US Gulf Coast regular gasoline and diesel. These gradually have retreated from their 2011/2012 peaks.

Note the similar weakness in emerging stock marketplaces “in general”, including China’s. Indeed, Chinese economic growth probably is significantly less than many believe. Given China’s major role in the world commodities arena, that portends further weakness in the overall commodities universe (see the S+P broad GSCI or other indices) and petroleum in particular.

Moreover, the Federal Reserve continues to taper its gargantuan bond buying (money printing) program. Ceasing money printing in 2010 and 2011 encouraged United States equity (use the S+P 500 as a benchmark) and commodity (and emerging stock) marketplace weakness. Though history may not repeat itself, the Fed’s ending of this round of quantitative easing probably will maintain the current sideways to down pattern in the petroleum complex. In recent years, the S+P 500 and commodities “in general” (including the overall petroleum complex) have tended to make noteworthy marketplace turns around the same time. Though the S+P 500 of course continued its bull move since spring 2011 while commodities in general moved in sideways to down fashion, this timing turning point relationship since spring 2011 has tended to persist.

Moreover, overall OECD petroleum industry inventories probably are slightly high, with total US days coverage several days above average. Supply/demand estimates for calendar 2014 indicates that global oil stocks will not decline much if at all this year.

1

2

FOLLOW THE LINK BELOW to download this article as a PDF file.
The Petroleum Theatre (5-5-14)
Charts- NYMEX and Brent crude oil

PETROLEUM SPREADS AND FINANCIAL TRENDS © Leo Haviland December 10, 2012

Petroleum is a key part of the broad GSCI and many other commodity indices. Of course not all commodities travel in the same direction, for they have diverse supply/demand situations. And marketplace timing relationships are not precise; commodities (even within a specific sector such as petroleum) do not all embark in a bull or bear trend at or around the same time. The overall petroleum complex, a key chapter in the commodities in general story, nevertheless has marched more or less alongside the S+P 500.

Each of the assorted petroleum spreads has its own supply/demand variables. Picture a front-to-back intramarket NYMEX crude oil spread or a US Gulf Coast gasoline crack (refining margin) spread. An analytical connection portraying a relationship between petroleum spreads to the S+P 500 and economic recovery (decline) and Federal Reserve policies may seem to be a fairly long stretch.

Yet the price and time movements of one or more important petroleum spreads often “confirm” or warn of changes in outright price trends in the overall petroleum price complex (and its individual marketplaces such as Brent/NSea crude oil, or US Gulf Coast gasoline). So in a web where flat price petroleum patterns generally (roughly) coincide with those of the broad GSCI, trends in oil spreads offer guidance to the broad GSCI trend. Given the rather close bull (and bear) shifts between the GSCI and the S+P 500, petroleum spreads therefore sometimes can offer insight into S+P 500 trends (and into US and international economic growth trends as well). And so Federal Reserve policies tie into some petroleum spread marketplaces. Keep in mind, however, that perceived connections between petroleum spreads and these other domains are only guidelines, and they are not unchanging. Read the rest of this entry »