GLOBAL ECONOMICS AND POLITICS

Leo Haviland provides clients with original, provocative, cutting-edge fundamental supply/demand and technical research on major financial marketplaces and trends. He also offers independent consulting and risk management advice.

Haviland’s expertise is macro. He focuses on the intertwining of equity, debt, currency, and commodity arenas, including the political players, regulatory approaches, social factors, and rhetoric that affect them. In a changing and dynamic global economy, Haviland’s mission remains constant – to give timely, value-added marketplace insights and foresights.

Leo Haviland has three decades of experience in the Wall Street trading environment. He has worked for Goldman Sachs, Sempra Energy Trading, and other institutions. In his research and sales career in stock, interest rate, foreign exchange, and commodity battlefields, he has dealt with numerous and diverse financial institutions and individuals. Haviland is a graduate of the University of Chicago (Phi Beta Kappa) and the Cornell Law School.


Subscribe to Leo Haviland’s BLOG to receive updates and new marketplace essays.

RSS View Leo Haviland's LinkedIn profile View Leo Haviland’s profile


US ELECTION 2020: POLITICS, PANDEMIC, AND MARKETPLACES © Leo Haviland June 3, 2020

CULTURAL OVERVIEW: A HOUSE DIVIDED

Competing aphorisms and advice abound regarding the uncertainties, unpredictability, probabilities, risks, opportunities, and appropriate viewpoints and methods in marketplaces such as stocks, interest rates, currencies, commodities, and real estate. Political stages also fill with diverse adages, slogans, perspectives, approaches, insights, foresights, predictions, and explanations.

The American cultural scenes (economic, political, and social) and opinions regarding them interrelate, and these entangle relatively closely with numerous foreign ones in a globalized world. This reflects and encourages wide ranges in outlook and recommendations for behavior.

****

American history reflects and describes a generally-shared culture, which the American Dream concept significantly reflects. However, over the span of about four centuries (and even in recent decades) that culture and interpretations of it have not been unchanging. The degree of consensus has varied. Moreover, not all groups have been equally able to participate in the economic, political, and social benefits (promises; valued “good” aspects) of the American Dream.

****

Thus America, even when united, always has had some internal differences in viewpoint (including opinions on the proper applications of a generally shared cultural theory) and thus assorted episodes and varying degrees of conflict. Let’s concentrate on today’s political panorama, which reflects (is permeated by) economic phenomena and interests. Admittedly, we’re not dwelling in the Civil War era of the mid-19th century. And the present-day United States political landscape (its ideological and structural parameters) is not anarchic. Nevertheless, the nation’s current political situation displays extensive divisions across numerous fields. The number and sharpness of these splits arguably have been increasing over the past few decades, as well as increasing (or at least becoming more evident) since President Trump’s 2016 election campaign and triumph.

A rapid survey of the United States unveils a country significantly divided across belief (doctrinal) dimensions as well as group membership categories. Subjective views occur on a continuum. For example, not all so-called “conservative” opinions are identical. Or, a given “liberal” (or progressive or globalist) may support some “nationalist” policies. Of course not all members of a given racial (ethnic), sex, or age category embrace the same opinion on a given policy or set of them. Consequently, beliefs, groups, and individuals do not necessarily or inevitably all end up on the same side of a ledger. Moreover, definitions and applications of political and other cultural labels can and do change. How should we define and measure liberty, freedom, and equality?

Anyway, numerous divisions apparently exist. These reflect values, visions for what is “good”, “bad”, and “neutral”. Cultural values inescapably involve emotions, not just reasoning; and emotions permeate the reasoning.

Look not only at (and within) the leading political parties, the Democrats (blue) and Republicans (red). The political spectrum reveals a range of opinions from left-wing to right-wing. Populists (which include left and right sides in orientation) battle against the “establishment” and associated elites (“the Man”; an entrenched political/economic/social power structure). Nationalists (“Make America Great Again!” is one mantra) fight against globalists (and multiculturalists); conservatives (or alleged reactionaries) combat liberals (perhaps some of these are progressives) and socialists (radicals; anarchists). Assorted political and economic “haves” fight in assorted ways with “have-nots”. Ardent debates rage about economic inequality and opportunity as well as social mobility. Allegiance to “capitalism” and the “free market” (however defined) varies in scope and intensity. Other contentious issues include abortion, the environment (including climate change), health care, immigration, race relations, gun control, and international trade. Such viewpoints incorporate values and result in propaganda battles to advance aims and defeat foes.

Within American political life and its communities, note the language (metaphors) of war, battle, and violence. Also examine wordplay of love and friendship. For example, people may love (or hate) a political candidate or party and its policies.

Rather lofty US government deficit spending has become entrenched. And sometimes, like nowadays in the coronavirus era (which involves a war against the disease), most Americans appreciate a generous helping hand and support a large (expensive) economic rescue package. However, significant disagreement remains regarding the role and extent of the federal government in our lives. Fervent quarrels burst into the open as to the appropriateness of, relative importance of, and actual expenditure on specific programs.

What generic cultural classifications to which individuals belong nowadays reflect (and offer opportunities for and encourage) partisanship and rhetorical conflict? These are numerous. The body politic is fractured. Noteworthy divides exist on the basis of race/ethnic, sex/gender and sexuality, age/generation, geographical location (region of the country; urban/suburban/rural), religion/faith, and level of wealth/income.

****

In politics, economics, and elsewhere in culture, although a subjective consensus sometimes develops and persists, participants also can and do disagree on what information (facts, evidence, factors, data, statistics) is relevant and on the relative importance of such variables, as well as on the proper means of organizing and evaluating such phenomena. Where widespread cultural divisions exist, as in America nowadays, such diverse debates (dissonance) relating to “the facts” at times can severely challenge the abilities of even knowledgeable and experienced forecasters to predict a particular outcome, such as the 2020 American Presidential election battle between Trump and Biden, with a high degree of confidence.

Moreover, to the extent that citizens have diminished faith in political institutions and leaders, this increases (encourages) the potential for cultural splits and wars. Arguments from authority may become less compelling to the “average citizen”; many disagreements tend to become harder to resolve. It’s often difficult for enemies to make peace. This situation can boost the amount and loudness of divisive rhetoric and thus make it significantly harder to predict some outcomes.

History shows that a willingness to compromise, listen closely to and respect opposing views and values, and practice substantial civility ebbs and flows on political stages, even when differences between rivals are substantial. However, the American political scene during the Trump regime generally manifests a weakening inclination to do so by many participants. This increases the rhetorical racket.

The information revolution obviously is a complex topic. Nevertheless, the voices unleashed nowadays in cultural domains via mass communication media create and sustain Towers of Babel. And the internet in particular enables a “democratic” explosion of voices seeking to achieve some form of power, to become or remain relevant and influential. The massive amount of allegedly relevant information potentially important to “appropriate” cultural decision-making and the proliferation of supposedly satisfactory gurus and guides (opinion-makers) thereby at times can exacerbate the difficulty of predicting political and economic outcomes.

FOLLOW THE LINK BELOW to download this article as a PDF file.
US Election 2020- Politics, Pandemic, and Marketplaces (6-3-20)

THE OIL BATTLEFIELD: EVOLUTION, RELATIONSHIPS, AND PRICES © Leo Haviland, April 10, 2017

In “Street Fighting Man”, The Rolling Stones sing:
“Everywhere I hear the sound of marching, charging feet, boy
‘Cause summer’s here and the time is right for fighting in the street, boy”.

****

OVERVIEW AND CONCLUSION

The continued determination of leading OPEC members (such as Saudi Arabia) and some key non-OPEC oil producing nations (such as Russia) to subdue their crude oil output will underpin petroleum prices. The Saudis and their allies will not readily sacrifice their long-sought production restraint agreement achieved with several important non-OPEC exporters in late 2016. Assuming supply discipline by key producers and moderate global economic growth, supply/demand estimates indicate that OECD (advanced nations such as the United States) industry inventories by the end of calendar 2018 will have declined to around “normal” levels in days coverage terms.

Even gigantic producers such as Saudi Arabia and Russia (for political as well as economic reasons) need to generate at least moderate income. Given its planned sale of shares in Aramco via an initial public offering, does Saudi Arabia want a renewed collapse in petroleum prices to $40 Brent/North Sea or less? Given its need for revenues, global political ambitions, and signs of domestic unrest, does Russia want petroleum prices to plummet sharply?

Other political worries help to bolster oil prices. Some (as usual) relate to the Middle East. North Korea’s nuclear program captures headlines. What if Venezuelan political turmoil results in a supply interruption?

However, current OECD petroleum industry inventories remain far above average. Even by end calendar 2017, they probably will be several days above normal. And end calendar 2018 obviously is a long time from now. Compliance with the OPEC/non-OPEC output guidelines by several individual countries has not been universal. And going forward, production discipline should not be taken for granted. Will Iraq and Iran moderate their production? What if Nigerian or Libyan production increases? Also, the net noncommercial position in the petroleum complex, which played a very important part in the explosive oil bull move in oil that began in first quarter 2016, is still quite high and vulnerable to liquidation.

History reveals that petroleum price levels and trends intertwine with currency, interest rate, stock and other commodity marketplaces (particularly base and precious metals) in a variety of ways. The current interrelationship between petroleum and these other arenas probably warns that it will be difficult for petroleum prices to sustain advances much above their first quarter 2017 highs.

****

Using NYMEX crude oil (nearest futures continuation) as a benchmark, petroleum prices for the next several months likely will stay in a broad range. Major support exists at around $38.00/$42.00. Significant resistance exists between $52.00/$55.25.

However, assuming ordinary international economic growth, what if OPEC/non-OPEC production discipline continues for the next year and a half (or marketplace faith increases that such restraint will persist)? In this scenario, if (and this “if” is a very important if) no sustained significant weakness in global stock marketplaces (and intertwining/confirming patterns in the US dollar, interest rates, and metals) develops, then NYMEX crude oil prices probably will attack the $60.75/$65.00 range.

FOLLOW THE LINK BELOW to download this article as a PDF file.
The Oil Battlefield- Evolution, Relationships, and Prices (4-10-17)

STEPPING HIGHER: UST TWO YEAR NOTE YIELDS © Leo Haviland September 21, 2014

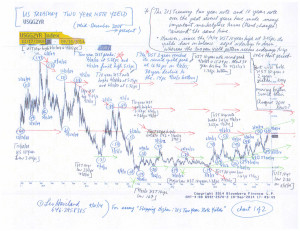
The US Treasury two year and 10 year notes over the past several years have made many important marketplace turns around the same time. The yield spread relationship between those instruments provides insight into and offers guidance regarding Federal Reserve policies. Although other variables of course are relevant, this spread offers indications regarding the extent of American (and international) economic strength or weakness.

Important trend moves in the 10 year less two year United States government yield spread often have roughly coincided with significant Federal Reserve Board policy decisions (sometimes assisted by major ones by the European Central Bank and others). Especially since around the time of its mid-December 2008 low around 125 basis points (10 year yield higher than two year; a positive yield curve), and thus during the Fed’s yield repression and quantitative easing era, the 10 year less two year spread has tended to widen (become more positive) during times of US economic growth (or notable signs or hopes for it) and decline during times where economic expansion slows or slumps (or when fears rise that this will occur). Fed quantitative easing moves link up with a widening of the yield spread (particularly via boosting the 10 year UST yield). The ending of the Fed’s money printing ventures have tied to narrowing of the yield spread (especially via falls in the UST 10 year yield). A narrowing pattern in this spread and the UST 10 year itself after the ending of QE (including the current tapering round) suggests that noteworthy “underlying” weakness remains in the US economy. See “Bond Yield Perspectives: Easing Comes: Easing Goes” (9/1/14) and related essays.

However, since the UST 10 year’s 1/9/14 plateau at 3.05pc, its yields on balance have moved sideways to down, whereas the two year yield pattern seems sideways to up over that period. The slip in the 10 year yield since then, given the Fed’s determination to increase inflation, indicates less than robust US (worldwide) economic growth. The increase in two year yields may reflect Fed plans more than notable overall economic strength (or the Fed’s faith that such strength is or will soon emerge). Yet will yields for both UST notes keep moving higher since their mid-August 2014 lows?

From the depths of the international economic disaster through most of the succeeding years, these US Treasury yield curve ventures (trend changes) generally have occurred around the same time as significant moves not only in the US Treasury 10 year note but also in the US stock marketplace (S+P 500). Many lows in the 10/2 UST yield curve spread have tied up with (occurred within a few months of) important S+P 500 bottoms; pinnacles in the spread likewise connect somewhat closely in time with plateaus in the US stock landscape.

However, whereas the 10 less two year spread and the 10 year yield itself have declined in recent months (265 basis point high in the yield spread 12/31/13; 3.05pc high on 1/2/14 for the UST 10 year), the S+P 500 this year has ascended to new highs over 2000. Thus the S+P 500’s relationship relative to the 10 less two year spread and the UST 10 year itself seems to have diverged from its prior pattern.

Significantly, the rise in two year note yields since very late 2013/early 2014 contrasts with the fall in the UST 10 year yield and the narrowing of the 10 less two year spread. Since end December 2008, roughly simultaneous declines in the 10 year note yield and the 10 less two year UST spread have been associated with a relatively weak US economic situation (or fears that such feebleness will emerge; international players such as the Eurozone affect this picture).

This slide in the 10 year note and the 10 less two year UST spread connects with the end of Federal Reserve money printing festivals, including the current one. Thus the US may be economically weaker (or more vulnerable to such feebleness) than many marketplace players or even the Fed (judging from its Fed Funds projections) perceives.

Emerging stock marketplaces have not followed the S+P 500 up to record highs. Given the slowing of economic growth in those economies, this represents a warning that the massive bull move in the S+P 500 may not continue forever. Look at the “MSCI Emerging Stock Markets Index” (from Morgan Stanley: MXEF). The MXEF over the past year or so has advanced from lows near in time to those in the S+P 500. Note the MXEF troughs at 878 on 6/25/13, 905 on 8/28/13, and 914 on 2/4/14. However, the MXEF remains below its Goldilocks Era pinnacle at 1345 (11/1/07), as well as 4/27/11’s 1212 plateau. In addition, it has started to fade from its recent top at 1104 on 9/4/14 (despite the ECB’s monetary easing action). If the MXEF starts to step significantly lower (keep an eye on 2/29/12’s high at 1085 and 1/3/13’s one at 1083), that will suggest increasing risks for the S+P 500 (especially if the UST 10 year yield also is unable to breach the 3.05pc level). Renewed weakness in emerging stock marketplaces increases the odds that the continued S+P rally will end (S+P 500 divergence from UST 10 year and 10 less two year trends will cease).

The S+P 500 eventually dropped after QE1 and QE2 ended. Since the current round of US quantitative easing will end in October 2014 (tapering of purchases will finally finish), one should be especially watchful for a reversal (even if it is modest) of the S+P 500’s epic bull trend.

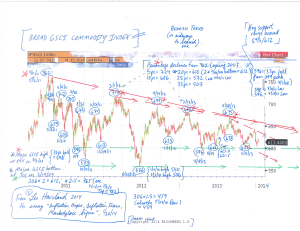
Another sign of sluggish economic growth, particularly in emerging marketplaces, has been the decline in commodities “in general” since spring 2011 (broad Goldman Sachs Commodity Index/GSCI). The GSCI peaked at 762 on 4/11 and 5/2/11. Since then, it generally has displayed a pattern of declining (lower and lower) highs. It recently made an interim top around 673 on 6/23/14, slipping to 582 on 9/15/14.

Charts--Two-Year-UST,-10-Year-v-2-Year-UST-spread-(9-21-14,-for-essay-Stepping-Higher--UST-Two-Year-Note-Yields)-2

Charts--Two-Year-UST,-10-Year-v-2-Year-UST-spread-(9-21-14,-for-essay-Stepping-Higher--UST-Two-Year-Note-Yields)-1

FOLLOW THE LINK BELOW to download this article as a PDF file.
Stepping Higher- US Two Year Note Yields (9-21-14)
Charts- Two Year UST, 10 Year v 2 Year UST spread (9-21-14, for essay Stepping Higher- UST Two Year Note Yields)

INFLATION HOPES, DEFLATION FEARS, MARKETPLACE SIGNS © Leo Haviland January 20, 2014

In the current environment, many central bankers in so-called advanced nations such as the US, Europe, Japan, and the United Kingdom (and in many other places around the globe) have adopted an inflation ideology. The IMF’s leading light heralds in her speech: “With inflation running below many central banks’ targets, we see rising risks of deflation, which could prove disastrous for the recovery. If inflation is the genie, then deflation is the ogre that must be fought decisively.” For OECD-type (advanced) countries, one can summarize the current version of that beloved doctrine: “moderate inflation of around two percent is good, lower than that is not very good (or maybe even a little bit bad), and deflation is definitely bad.” It is unclear how much inflation (in the opinion of marketplace generals these days) would be inappropriate (bad), but arguably over five percent on a sustained basis definitely would be bad (evil; monstrous).

Suppose worldwide deflationary forces remain very significant. Perhaps credit (and debt) and leverage problems developed during the Goldilocks Era (and probably during quite a few years before then) have not been solved. Suppose the worldwide economic crisis that emerged in 2007 and accelerated in 2008 did not create sufficient deflation to remedy the inflationary issues previously built up. Then lax monetary policy at best (even if accompanied by substantial deficit spending) may create mediocre real economic growth, generate less than desired (sufficient) inflation, and only modestly improve the dismal unemployment picture.

The trends of recent years show declines in real US median (and mean) income. Commodities have been in a downtrend since their peaks in spring 2011. Of course commodities are only one part of consumer price indices. And wages and incomes are not the same as consumer prices. Yet these trends in US income and the broad GSCI indicate that “inflation in general” (including such measures as the consumer price index, PCE, and GDP deflator) is strongly entrenched at low levels. In addition, unless the Fed and other central banks embark on even more massive easing than they have done thus far, this income and commodity evidence (especially when interpreted alongside the low rates of CPI-type inflation) suggests that it probably will be very difficult for “inflation in general” to rise much if at all from current low levels. And “very low” inflation (or even deflation) eventually may appear outside of the real income and commodity territories (especially if US and related interest rates leap higher).

In any event, the US income statistics and broad GSCI bear trend indicate that despite all the Fed (and other central bank) easing, the creation of sustained “sufficient” consumer price (or PCE) inflation remains a huge challenge. Given the intertwining of inflation policies and phenomena (and forecasts) with those of real GDP and unemployment, these notable wage and commodity trends hint that real GDP increases probably will be less than regulators and politicians (not just in the US) aim for, and that unemployment probably will not fall as much as desired.

Chart--Broad-GSCI-(for-essay,-Inflation-Hopes,-Deflation-Fears...)-(1-20-14)

FOLLOW THE LINK BELOW to download this market essay as a PDF file.
Inflation Hopes, Deflation Fears, Marketplace Signs (1-20-14)
Chart- Broad GSCI (for essay, Inflation Hopes, Deflation Fears…) (1-20-14)