GLOBAL ECONOMICS AND POLITICS

Leo Haviland provides clients with original, provocative, cutting-edge fundamental supply/demand and technical research on major financial marketplaces and trends. He also offers independent consulting and risk management advice.

Haviland’s expertise is macro. He focuses on the intertwining of equity, debt, currency, and commodity arenas, including the political players, regulatory approaches, social factors, and rhetoric that affect them. In a changing and dynamic global economy, Haviland’s mission remains constant – to give timely, value-added marketplace insights and foresights.

Leo Haviland has three decades of experience in the Wall Street trading environment. He has worked for Goldman Sachs, Sempra Energy Trading, and other institutions. In his research and sales career in stock, interest rate, foreign exchange, and commodity battlefields, he has dealt with numerous and diverse financial institutions and individuals. Haviland is a graduate of the University of Chicago (Phi Beta Kappa) and the Cornell Law School.


Subscribe to Leo Haviland’s BLOG to receive updates and new marketplace essays.

RSS View Leo Haviland's LinkedIn profile View Leo Haviland’s profile


US INFLATION SIGNALS © Leo Haviland June 7, 2015

In their noble war to generate sufficient inflation, insure economic recovery, and slash unemployment, central bankers in America, Europe, and Japan have fought with extraordinary weapons such as monumental money printing and longstanding interest rate yield repression. On the inflation front, they battle furiously to achieve and sustain an inflation target of about two percent. This allegedly good (desirable, reasonable, prudent) goal contrasts not only with bad “excessive” inflation, but also with bad “too low” inflation and evil (or at least really bad) of deflation.

For several months, widely-watched inflationary yardsticks such as the consumer price index indicated too low inflation or inflamed worries regarding deflation. The consequences of the 2007-2009 international economic disaster probably have not disappeared, and the dramatic slump in petroleum prices after mid-2014 has troubled many inflation seekers. In any event, most economic forecasters, including central banking captains, have postponed the achievement of sufficient inflation as measured by such signposts rather far out into the future. Consequently, marketplace warriors, political leaders, and the financial media have focused relatively little on other gauges warning of notable potential for increased inflation in benchmarks such as the consumer price index.
****

The worldwide global economy of course is interconnected and complex. Numerous variables intertwine to produce any given inflation level and trend. Inflation acceleration need not appear first or strongest in beloved indicators such as consumer prices or personal consumption expenditures. Although the United States is not a financial island, focus on the American landscape.

“Inflation” is not confined to measures such as the CPI or personal consumption expenditures; “the economy” includes other inflation benchmarks. Various indicators signal there is more inflation “around” in the US than most believe. Underline American wage increases. Note central bank and marketplace murmurings regarding high valuations or so-called asset bubbles; keep in mind the climbs in US equities and home prices from their financial crisis depths. Money supply growth remains robust. The steely determination of the Fed and its central banking allies to achieve their inflation objectives heralds that monetary policy probably will remain quite lax for some time even if the US eventually raises rates. These factors collectively warn that at least in America, deflationary forces “in general” have found strong adversaries. The recent spike in key interest rates such as the 10 year US government note (and the German Bund) in part reflects this inflation.

Despite the recent rate of change in US consumer prices and personal consumption expenditures, probably neither deflation nor dangerously low inflation are on the American horizon. In addition, sustained “too low” inflation in America probably should not be a worry for the near term. Nevertheless, although a sustained jump in PCE and CPI inflation rates much beyond the Fed’s desired two percent target currently appears unlikely, “sufficient” inflation in America may be achieved faster than many predict.
****

“Flights to quality”, hunts for suitable yield (return), and other supply/demand considerations, not just low inflation statistics, can rally prices of debt securities. Yet did sustained central bank yield repression create or at least encourage “too low” yields for (a price “bubble” in) key government debt securities such as those of the United States and Germany? In the Eurozone, the terrifying enemy called deflation neared. The European Central Bank fired back with a huge quantitative easing (money printing) plan involving government debt securities. Some European government security interest rate yields went negative.

However, was a US (and German) debt security price bubble recently popped?

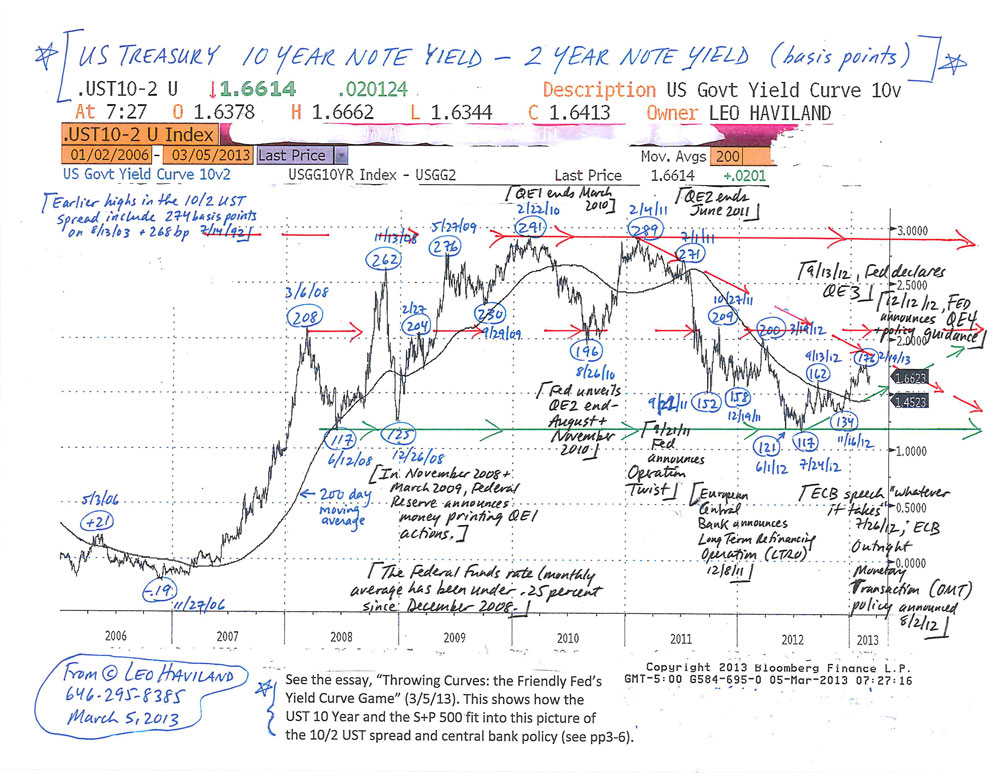
The 10 year US government note established an important yield low at 1.64 percent on 1/30/15, above 7/25/12’s major bottom at 1.38pc. Since January 2015’s valley, the US 10 year rate shot up about 50 percent to 6/5/15’s 2.44pc. The 1/2/14 summit at 3.05pc represents important resistance. In any case, what should the yield on US 10 year government notes be if inflation (such as in the PCE) is 1.5 percent or higher?

The 10 year German government note made a key bottom on 4/17/15 close to zero, at .05 percent (not long after the UST 10 year note made a minor low at 1.80pc on 4/3/15). Bund yields thereafter blasted higher, reaching almost one percent on 6/4/15. The Japanese 10 year JGB made a significant trough in 2015 shortly before the UST’s, on 1/20/15 at .20 percent.

US stocks advanced victoriously from their March 2009 major low for many reasons, including strong corporate earnings and share buybacks. Yet money printing and yield repression also assisted the S+P 500’s mighty ascent. So if US stocks recently reached “too high” levels, perhaps rising interest rates (or growing fears of them) will inspire those equities to retreat (burst their bubble).

Regardless of whether or not American government note yields recently were (or are still) “too low”, the recent sharp increase in UST 10 year note rates may reflect not just a “technical correction” or a growing belief that the Federal Funds rate (and thus yields in US government securities) will rise in the relatively near future. That noteworthy UST yield leap probably also warns that US inflation “in general” has grown or will do so soon.

FOLLOW THE LINK BELOW to download this article as a PDF file.
US Inflation Signals (6-7-15)

THROWING CURVES: THE FRIENDLY FED’S YIELD CURVE GAME © Leo Haviland March 5, 2013

In professional sports such as baseball and Wall Street’s competitive marketplaces, history is not destiny. However, “the past” and variables apparently relevant to it need not be discarded as being of little or no importance, relevance, or guidance for current and future playgrounds. During the worldwide economic crisis that dawned in mid-2007 and the ensuing recovery, noteworthy moves in the 10 year less two year United States government yield spread often have roughly coincided with significant Federal Reserve Board policy decisions (and several months ago with major European Central Bank ones). These US Treasury yield curve ventures (trend changes) generally have occurred around the same time as significant moves in the US Treasury 10 year note and the US stock marketplace (S+P 500). Many lows in the 10/2 UST yield curve spread have tied up with (occurred within a few months of) important S+P 500 bottoms; pinnacles in the spread likewise link up somewhat closely in time with plateaus in the US stock playground.

The UST 10 year less two year spread probably established a major bottom on 7/24/12 at 117 basis points (10 year yield higher than two year return, so a positive yield curve; short rates over long rates creates a negative yield curve).

What would a further notable widening of the spread (steepening of the curve, more positive slope) from current heights around 165 basis points suggest to avid financial marketplace fans? Perhaps a sustained move in this 10/2 UST spread over around 200 to 210 basis points will indicate a renewed (further) strengthening of the US (and worldwide) economic recovery.

However, that upward path over 200/210 basis points instead may warn of impending economic weakness. This viewpoint is not necessarily as off base as some may claim. One needs to focus on whether America is a key source of and significant spark for likely global (not just US) feebleness.

In that regard, recall the shift from 6/12/08’s 117 basis point low (same as 7/24/12’s) up to 11/13/ 08’s 262bp as the financial crisis raced forward (Lehman Brothers bankruptcy 9/15/08). The US housing and financial leverage (banking system) problems were critical issues (though of course not confined to the US), even though the US (and the world in general) did not in mid-2008 yet face major fiscal troubles.

Why might the 10/2 UST spread widen (as in mid-June to mid-November 2008) nowadays or in the near or medium term? In some circumstances, there can be a dismal widening of the UST spread (and higher long term rates) accompanied by little or no economic growth (or even a recession). Suppose the current US (and international) economic horizon darkened significantly. Assume a big fiscal difficulty in the US is a major factor in this bleak outlook. Then maybe this time around, when economic downturn risks in general still loom large, there will not be as nearly as substantial a flight to quality into UST as there was at end 2008 (after mid-November) and as there has been at subsequent economic (downturn) crisis periods since then up to the present time. Thus this setup probably would produce an outcome for the 10/2 yield spread very unlike its pattern during the previous substantial financial deteriorations of the mid-November 2008 to the present time span. Many players (especially international ones) may not view the UST as wonderful quality (especially when nominal yields are so mediocre) if the US may or does become the star of a fearsome fiscal problem and related systemic economic crisis.

Yet the history of the past several years also warns that a slump in the 10/2 UST spread back close to around the July 2012 bottom probably signals US (and global) economic weakness as well.
US-Treasury-10-Year-versus-2-Year-Note-Chart-(3-5-13)
FOLLOW THE LINK BELOW to download this market essay as a PDF file.
Throwing Curves- the Friendly Fed’s Yield Curve Game (3-5-13)
US Treasury 10 Year versus 2 Year Note Chart (3-5-13)

AMERICAN MARKETPLACES: AT THE CROSSROADS © Leo Haviland October 15, 2012

The world’s long-running economic crisis of course has not limited itself to either one nation or one region. However, at its outset in 2007, most did not anticipate the scope or length of the disaster. Weren’t potential risks to the international economy rather modest? Weren’t issues related to the United States real estate marketplace mostly relevant only to that domain and that nation, and likely to be restricted to them? Yet substantial debt and leverage (and other intertwined issues) and their consequences were not confined either to American territory or the real estate playground.

The recent Eurozone chapters of this terrible trouble supposedly started with so-called peripheral nations such as Greece, Portugal, and Ireland. Countries such as Greece indeed first captured headlines. However, that does not demonstrate that causes of Eurozone problems necessarily started only in them. In any event, “difficulties on the periphery” engulfed the rest of Europe and traveled around the globe.

Despite broad concerns regarding worldwide economic problems and risks, despite the widespread past and current fascination with the European scene, suppose one focuses on aspects of the American stage, beginning with some highlights involving the United States alongside Canada and Mexico in the foreign exchange context. This survey of America and its geographic neighbors underlines the weakness of the United States dollar and the size of America’s fiscal troubles. This suggests the merit of inquiring into US currency, stock, interest rate, and commodity marketplace past and future relationships in the context of Federal Reserve easing policies and America’s fiscal problems.

The broad real trade-weighted dollar probably will continue to weaken. The dangerous United States fiscal situation probably will not be genuinely fixed in the next several months. A full- fledged threat of a federal fiscal catastrophe likely will be necessary for sufficient progress in that sphere to occur. Though the United States is not the center of the universe, the effects of further dollar feebleness and the worsening of the country’s fiscal crisis will radiate worldwide.

The S+P 500 has made or soon will make a significant peak.

Thus the emerging (current) story and trend appears to be: weaker dollar (TWD), weaker S+P 500, and higher government rates (UST 10 year benchmark). This vision admittedly is dramatically different from the current popular faith in these marketplace relationships.


FOLLOW THE LINK BELOW to download this market essay as a PDF file.
American Marketplaces- At the Crossroads (10-15-12)
Charts- US Dollar v Canadian Dollar, Mexican Peso (10-15-12)

EUROPEAN DEBT DANGERS: SELLING SOLUTIONS, BUYING TIME…YIELDING RESULTS? © Leo Haviland, January 17, 2012

Though global marketplaces and their problems intertwine, let’s concentrate on recent European debt developments and related statements alongside a review of several European interest rate spread relationships. This inquiry underlines that the heated efforts by European (and American and other) economic (political) generals have yielded only partial progress in vanquishing the challenges of the worldwide international crisis. So the worldwide international economic crisis probably will march onward for quite some time. And there is more than a little chance that it will worsen.

A review of yield spreads between the 10 year government debt of Germany and the key Eurozone nations of Spain and Italy over the past year or so underlines the gradually growing sovereign debt and banking stresses on Europe (and therefore on other territories and marketplaces). In addition, these widening European spread trends, especially when reviewed in the context of stock marketplace, currency, and commodity ones, point out the limited (merely partial) successes of efforts to solve the European sovereign debt and banking crisis in particular (and the worldwide economic disaster in general). These spreads warn of dangers to European (and global) economic growth.

Compare the timing of the German 10 year’s high on 4/11/11 at 3.51pc with the April 2011 lows in the German 10 year’s spread against Spanish, Italian, and Hungarian government debt. Keep in mind the pattern of higher lows in the Spanish/German and Italian/German spreads since mid-April 2011. For this mid-April 2011 timing perspective and its aftermath, remember the S+P 500’s high around then (on 5/12/11 at 1371) and that in the broad Goldman Sachs Commodity Index (4/11/11 and 5/2/11 at 762).

Euro FX weakness also reflects the Eurozone (European) crisis. Note the rough parallel since spring 2011 between the declining Euro currency (peak versus the US dollar 5/4/11 at 1.4940) and the gradual widening of the Spanish/German and Italian/German 10 year government spreads.

FOLLOW THE LINK BELOW to download this market essay as a PDF file.
European Debt Dangers- Selling Solutions, Buying Time…Yielding Results (1-17-12)